
Tap play to enjoy this article, and don’t forget to subscribe to RepuGen on Spotify for more insightful podcasts!
Abstract
Patient satisfaction shapes clinical outcomes, provider reputation, and patient loyalty. This whitepaper analyzes satisfaction drivers across the top 10 U.S. healthcare specialties using online reviews aggregated from RepuGen and RepuTally. By analyzing sentiment, ratings, and feedback on doctor interactions, staff performance, wait times, and billing, the study identifies key factors shaping patient experiences. These insights aim to help healthcare providers identify improvement opportunities, elevate service quality, and strengthen competitive differentiation.
Introduction
Patient satisfaction is essential for both clinical outcomes and building a trusted healthcare brand. Despite its significance, differences in patient satisfaction across specialties remain underexplored. This study addresses that gap by comparing the top 10 healthcare specialties from January 2020 to March 2025 using detailed online review data. Reviews were collected from Google, Yelp, Facebook, HealthGrades, RateMDs, WebMD, and Vitals. The goal is to identify key drivers of satisfaction differences and provide actionable recommendations for healthcare providers to refine their services and enhance patient experiences.
Methodology
Data Sources
This analysis draws from public online reviews compiled in RepuGen and RepuTally reports, covering Google, Yelp, Facebook, HealthGrades, RateMDs, WebMD, and Vitals.
Metrics: Raw Data and Standardized (Weighted) Reviews
The study assesses two types of metrics:
- Raw Data Metrics: These include total review volume and unadjusted satisfaction rates per specialty. For instance, the document provides raw review counts and percentages of positive (3–5★) and negative (below 3★) reviews.
- Standardized Metrics (Weighted Reviews): To allow a fair comparison across specialties with different numbers of providers and locations, raw review counts are adjusted. The weighted review is calculated using the average review per provider/location, ensuring a balanced assessment of patient satisfaction.
Results: Key Insights from Patient Reviews (Jan 2020 - March 2025)
Analyzing Raw Review Trends and Patient Satisfaction
| Review Volume and Satisfaction Across Top 10 Specialties (Jan 2020 - March 2025) - Raw Table | |||||||||
| Specialty Top 10 | Total Reviews | Positive Reviews Rate | Negative Review Rate | Positive Reviews (3 - 5 ★) | Negative Reviews (Below 3★) | # of Providers | # of Locations | Total Providers & Locations | % of Overall Review Volume Across All Specialties |
| Orthopedics | 857,435 | 95.70% | 4.30% | 820,517 | 36,918 | 18,619 | 859 | 19,478 | 21.70% |
| Urgent Care | 618,443 | 80.10% | 19.90% | 495,343 | 123,100 | 602 | 1,852 | 2,454 | 15.60% |
| Internal Medicine | 277,320 | 87.50% | 12.50% | 242,749 | 34,571 | 46,140 | 2,307 | 48,447 | 7.00% |
| Surgery | 255,052 | 90.80% | 9.20% | 231,619 | 23,433 | 30,606 | 1,133 | 31,739 | 6.40% |
| Dentistry | 248,477 | 92.90% | 7.10% | 230,893 | 17,584 | 4,437 | 1,862 | 6,299 | 6.30% |
| Dermatology | 244,704 | 91.70% | 8.30% | 224,330 | 20,374 | 9,305 | 1,423 | 10,728 | 6.20% |
| Primary Care | 230,549 | 84.20% | 15.80% | 194,082 | 36,467 | 42,319 | 2,798 | 45,117 | 5.80% |
| Family Medicine | 216,113 | 85.00% | 15.00% | 183,742 | 32,371 | 23,357 | 1,220 | 24,577 | 5.50% |
| Ophthalmology | 139,119 | 92.10% | 7.90% | 128,157 | 10,962 | 10,012 | 524 | 10,536 | 3.50% |
| Obstetrics and Gynecology | 135,624 | 84.70% | 15.30% | 114,847 | 20,777 | 14,764 | 481 | 15,245 | 3.40% |
This table presents review volumes for the top 10 medical specialties from January 2020 to March 2025, including total reviews, positive and negative review percentages, and each specialty's share of overall reviews.
Standardized Satisfaction Metrics (Weighted Reviews)
Graph: Weighted Reviews by Specialty Adjusted for Provider and Location Distribution
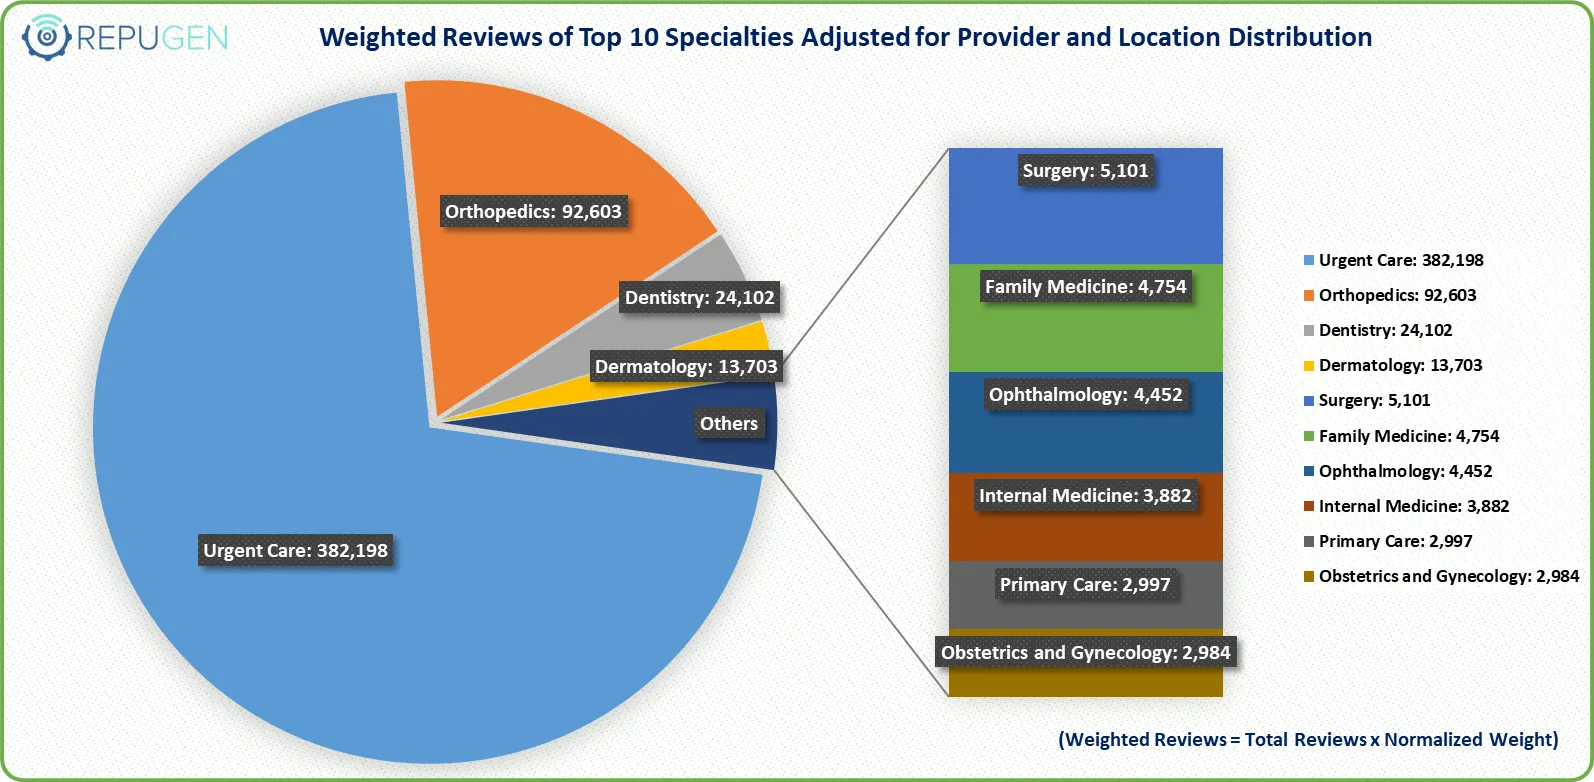
This graph displays the count of weighted reviews for the top 10 specialties, adjusted for provider and location differences. It provides a standardized satisfaction metric, clearly comparing specialty performance based on patient feedback.
Graph: Patient Sentiment Distribution: Weighted Positive and Negative Reviews by Specialty
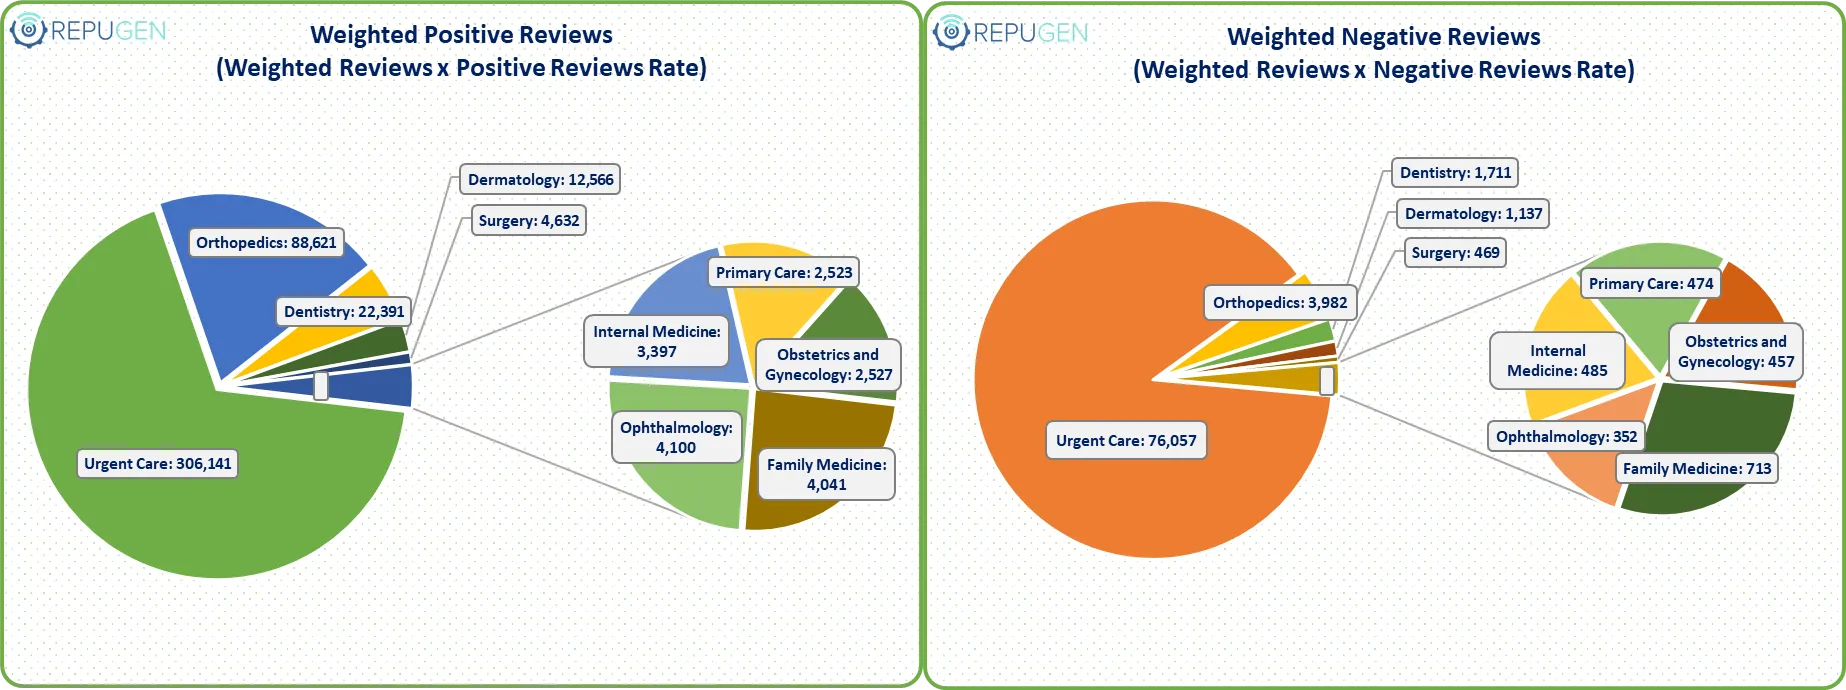
The graphs depict sentiment-adjusted weighted reviews across medical specialties. By applying positive and negative sentiment rates to weighted review volumes, this analysis offers a more accurate reflection of overall patient satisfaction and dissatisfaction, accounting for both volume and sentiment distribution.
Review Calculation Methodology
To fairly compare patient reviews across specialties, we use a weighted review approach that balances differences in provider and location counts.
| Step | Process | Description | Formula |
|---|---|---|---|
| 1 | Calculate Weight | Find average reviews per provider/location for each specialty |
Weight = Total Reviews ÷ (Providers + Locations)
|
| 2 | Normalize Weight | Scale weights proportionally for fair comparison across specialties |
Normalized Weight = Weight ÷ Sum of All Weights
|
| 3 | Weighted Volume | Apply normalized weight to get comparable review volume |
Weighted Reviews = Total Reviews × Normalized Weight
|
| 4 | Final Satisfaction | Calculate positive and negative weighted reviews using satisfaction rate |
Weighted Positive = Weighted Reviews × Satisfaction Rate
Weighted Negative = Weighted Reviews × (1 - Satisfaction Rate) |
| Metric | Value | Calculation |
|---|---|---|
| Total Reviews | 618,443 | Raw review count |
| Providers & Locations | 2,454 | Combined count |
| Weight | 252.01 | 618,443 ÷ 2,454 |
| Normalized Weight | 0.618 | 252.01 ÷ sum of all weights |
| Weighted Reviews | 382,198 | 618,443 × 0.618 |
| Satisfaction Rate | 80.1% | Given rate |
| Weighted Positive Reviews | 306,141 | 382,198 × 0.801 |
| Weighted Negative Reviews | 76,057 | 382,198 × 0.199 |
Conclusion
This weighted method ensures that no single specialty dominates the results due to having more providers or a higher volume of reviews. It delivers a clearer and more balanced view of patient satisfaction across all specialties.
| Weighted Review Calculations: Adjustments for Providers, Locations, and Review Volume | |||||||||
| Specialty Top 10 | Total Reviews | Total Providers & Locations | Weight (Total Reviews ÷ Total Providers & Locations) |
Normalized Weight (Weight ÷ ∑ Weight) |
Weighted Reviews (Total Reviews × Normalized Weight) |
Positive Reviews Rate |
Negative Review Rate | Weighted Positive Reviews (Weighted Reviews x Positive Reviews Rate) |
Weighted Negative Reviews (Weighted Reviews x Negative Reviews Rate) |
| Urgent Care | 618,443 | 2,454 | 252.014 | 0.618 | 382,198 | 80.10% | 19.90% | 306,141 | 76,057 |
| Orthopedics | 857,435 | 19,478 | 44.021 | 0.108 | 92,603 | 95.70% | 4.30% | 88,621 | 3,982 |
| Dentistry | 248,477 | 6,299 | 39.447 | 0.097 | 24,102 | 92.90% | 7.10% | 22,391 | 1,711 |
| Dermatology | 244,704 | 10,728 | 22.810 | 0.056 | 13,703 | 91.70% | 8.30% | 12,566 | 1,137 |
| Surgery | 255,052 | 31,739 | 8.036 | 0.020 | 5,101 | 90.80% | 9.20% | 4,632 | 469 |
| Family Medicine | 216,113 | 24,577 | 8.793 | 0.022 | 4,754 | 85.00% | 15.00% | 4,041 | 713 |
| Ophthalmology | 139,119 | 10,536 | 13.204 | 0.032 | 4,452 | 92.10% | 7.90% | 4,100 | 352 |
| Internal Medicine | 277,320 | 48,447 | 5.724 | 0.014 | 3,882 | 87.50% | 12.50% | 3,397 | 485 |
| Primary Care | 230,549 | 45,117 | 5.110 | 0.013 | 2,997 | 84.20% | 15.80% | 2,523 | 474 |
| Obstetrics and Gynecology | 135,624 | 15,245 | 8.896 | 0.022 | 2,984 | 84.70% | 15.30% | 2,527 | 457 |
| Overall (Sum) | 3,222,836 | 214,620 | 408.056 | 1.000 | — | — | — | — | — |
Purpose of Weighting Reviews:
When comparing different specialties with varying numbers of providers, locations, and reviews, using raw review counts alone can lead to bias. Some specialties naturally receive more reviews per provider (like Urgent Care), while others receive fewer. To ensure a fair comparison, we use a weighted method that adjusts for these differences. This method takes into account the number of providers and locations each specialty has and adjusts the review volume accordingly.
By calculating the average number of reviews per provider or location and weighting each specialty’s reviews based on that, we eliminate the bias caused by specialties with more providers or higher review activity. This ensures that no specialty dominates the comparison simply because it has more providers or more patient reviews in a specific area. Essentially, this approach is like adjusting the volume levels so each specialty’s "voice" can be heard equally, regardless of how many reviews are left in each area.
Insights from Raw vs. Weighted Reviews: A Simple Breakdown
Note: While this study focuses on the top 10 specialties in the U.S. based on review volume, the percentage of total reviews attributed to each specialty was calculated using the full dataset of reviews across all 46 specialties tracked by RepuGen and RepuTally.
Raw Review Volume Shows Reach, Not Always Satisfaction
Orthopedics accounted for the highest raw review volume, 857,435 reviews, representing 21.7% of all reviews analyzed across all specialties in the US. Despite the high volume, patient sentiment remained strong, with a 95.7% positive review rate and only 4.3% negative, indicating high satisfaction within the specialty.
Urgent Care followed with 618,443 reviews (15.6% share) with 80.1% positive reviews and the highest negative rate at 19.9%. Dermatology (91.7%) and Ophthalmology (92.1%) also have high approval from patients and fewer negative comments. Primary Care and Family Medicine had higher negative sentiment rates (15.8% and 15.0%) despite moderate review volumes.
Insight: A large number of reviews means the specialty is visible and attracts attention, but it doesn’t always mean the care is consistently good. Urgent Care, for example, gets a lot of feedback but struggles with quality, as shown by its higher rate of negative reviews.
Sentiment Trends Based on Weighted Reviews
Urgent Care led in both volume and satisfaction, with 306,141 weighted positive reviews and 76,057 negatives. Orthopedics followed with strong absolute sentiment (88,621 positives vs. 3,982 negatives) but showed reduced relative strength due to its broad provider base. Dentistry (22,391 positives vs. 1,711 negatives) and Dermatology (12,566 vs. 1,137) demonstrated consistently high satisfaction across networks.
Surgery (4,632 positives vs. 469 negatives), Family Medicine (4,041 vs. 713), and Primary Care (2,523 vs. 474) posted decent positive counts but lower relative sentiment.
Insight: Urgent Care leads in both scale and satisfaction, while Dentistry and Dermatology show strong sentiment consistency. Orthopedics highlights how provider volume can affect weighted outcomes.
Final Summary
- Raw reviews = reach & engagement
- Weighted reviews = satisfaction per provider
- Smaller or well-managed specialties consistently outperform
- Urgent Care is a standout, high scale with high satisfaction
Service Quality Assessment: Key Drivers of Patient Satisfaction Across Top 10 Healthcare Specialties
Patient Satisfaction Drivers Across Healthcare Specialties: Service Quality Ratings by Entity and Specialty
Medical Specialties Performance Rating
| Entity Type | Overall Ratings (1-5) | Specialty | Normalized Rating | Key Insights |
|---|---|---|---|---|
| Doctors | 4.4 | Urgent Care | 4.2 |
|
| Orthopedics | 4.7 | |||
| Dentistry | 4.3 | |||
| Dermatology | 4.5 | |||
| Surgery | 4.5 | |||
| Family Medicine | 4.4 | |||
| Ophthalmology | 4.5 | |||
| Internal Medicine | 4.4 | |||
| Primary Care | 4.3 | |||
| Obstetrics and Gynecology | 4.4 | |||
| Practice | 4.2 | Urgent Care | 4.1 |
|
| Orthopedics | 4.6 | |||
| Dentistry | 4.4 | |||
| Dermatology | 4.4 | |||
| Surgery | 4.3 | |||
| Family Medicine | 3.8 | |||
| Ophthalmology | 4.6 | |||
| Internal Medicine | 4.2 | |||
| Primary Care | 3.9 | |||
| Obstetrics and Gynecology | 3.4 | |||
| Nurses | 4.2 | Urgent Care | 4.4 |
|
| Orthopedics | 4.4 | |||
| Dentistry | 3.6 | |||
| Dermatology | 4.3 | |||
| Surgery | 4.4 | |||
| Family Medicine | 4.1 | |||
| Ophthalmology | 4.3 | |||
| Internal Medicine | 4.3 | |||
| Primary Care | 4.0 | |||
| Obstetrics and Gynecology | 4.1 | |||
| Physician Assistant | 4.3 | Urgent Care | 4.2 |
|
| Orthopedics | 4.5 | |||
| Dentistry | 4.1 | |||
| Dermatology | 4.2 | |||
| Surgery | 4.4 | |||
| Family Medicine | 4.3 | |||
| Ophthalmology | 4.3 | |||
| Internal Medicine | 4.2 | |||
| Primary Care | 4.5 | |||
| Obstetrics and Gynecology | 4.4 | |||
| Staff | 4.6 | Urgent Care | 4.7 |
|
| Orthopedics | 4.8 | |||
| Dentistry | 4.5 | |||
| Dermatology | 4.7 | |||
| Surgery | 4.8 | |||
| Family Medicine | 4.5 | |||
| Ophthalmology | 4.7 | |||
| Internal Medicine | 4.5 | |||
| Primary Care | 4.5 | |||
| Obstetrics and Gynecology | 4.5 | |||
| Manager | 3.2 | Urgent Care | 3.8 |
|
| Orthopedics | 3.3 | |||
| Dentistry | 3.1 | |||
| Dermatology | 2.8 | |||
| Surgery | 3.7 | |||
| Family Medicine | 3.0 | |||
| Ophthalmology | 3.2 | |||
| Internal Medicine | 3.2 | |||
| Primary Care | 3.0 | |||
| Obstetrics and Gynecology | 3.3 | |||
| Office | 4.1 | Urgent Care | 4.1 |
|
| Orthopedics | 4.3 | |||
| Dentistry | 4.1 | |||
| Dermatology | 4.1 | |||
| Surgery | 4.4 | |||
| Family Medicine | 3.9 | |||
| Ophthalmology | 4.2 | |||
| Internal Medicine | 3.9 | |||
| Primary Care | 3.9 | |||
| Obstetrics and Gynecology | 4.1 | |||
| Wait Time | 2.9 | Urgent Care | 2.9 |
|
| Orthopedics | 3.2 | |||
| Dentistry | 2.9 | |||
| Dermatology | 3.1 | |||
| Surgery | 3.0 | |||
| Family Medicine | 2.8 | |||
| Ophthalmology | 2.9 | |||
| Internal Medicine | 2.9 | |||
| Primary Care | 3.0 | |||
| Obstetrics and Gynecology | 2.6 | |||
| Billing Transparency | 2.8 | Urgent Care | 3.1 |
|
| Orthopedics | 3.0 | |||
| Dentistry | 2.9 | |||
| Dermatology | 2.5 | |||
| Surgery | 3.0 | |||
| Family Medicine | 2.9 | |||
| Ophthalmology | 2.9 | |||
| Internal Medicine | 2.6 | |||
| Primary Care | 2.5 | |||
| Obstetrics and Gynecology | 2.9 | |||
| Front Desk | 3.6 | Urgent Care | 3.7 |
|
| Orthopedics | 3.9 | |||
| Dentistry | 3.6 | |||
| Dermatology | 3.7 | |||
| Surgery | 3.9 | |||
| Family Medicine | 3.3 | |||
| Ophthalmology | 3.6 | |||
| Internal Medicine | 3.4 | |||
| Primary Care | 3.5 | |||
| Obstetrics and Gynecology | 3.4 |
This table presents patient satisfaction ratings across the top 10 healthcare specialties, organized by key service quality factors (entities). It enables a clear comparison of each specialty's performance in areas such as doctor interactions, office services, and billing, providing a comprehensive view of service quality across specialties.
Summary: What Drives Patient Satisfaction in Different Specialties
Top Performing Entities:
- Staff (4.6) are especially strong in Orthopedics and Surgery (4.8). All specialties score 4.5 or higher.
- Doctors (4.4) have Orthopedics (4.7) on top. Dermatology, Ophthalmology, and Surgery follow at 4.5, while Primary Care (4.3) and Urgent Care (4.2) score slightly lower.
- Physician Assistants (4.3) are highest in Primary Care and Orthopedics (4.5). Ob-Gyn and Surgery are close behind at 4.4, and Dentistry scores 4.1.
Mid-Level Ratings
- Nurses (4.2) did well in Surgery and Urgent Care but dropped in Dentistry (3.6).
- Practice satisfaction (4.2) is steady, though Primary Care (3.9), Family Medicine (3.8), and Ob-Gyn (3.4) are lower.
Low Ratings
- Managers (3.2) scored lowest overall, especially in Dermatology (2.8) and Primary Care (3.0).
- Wait Times (2.9) and Billing Transparency (2.8) are common issues, with the worst scores in Ob-Gyn and Primary Care (2.5–2.6).
Key Issues by Specialty
- Ob-Gyn, Family Medicine, and Primary Care: Strong clinical care but weak in wait times, billing, and management.
- Dermatology and Internal Medicine: Average care but poor administrative support.
Recommendations
- Fix admin issues in low-rated areas using workflow reviews and better scheduling.
- Use Orthopedics and Surgery as models for improving staffing and communication.
- Improve billing clarity with upfront estimates and better follow-up info.
- Reduce wait times using smarter scheduling and check-in tools.
- Train front desk and managers to improve engagement and performance.
Bottom Line
Strong clinical care isn’t enough. Patients consider every aspect of their journey, so every interaction matters. To boost overall satisfaction, focus on fixing wait times, billing, and management, especially in underperforming specialties.
Patient Satisfaction Findings and Recommendations
What We Learned from Patient Reviews
Patient satisfaction depends not just on medical skills but also on how well healthcare providers handle every part of the patient experience. We looked at over 3.2 million reviews across 10 specialties and found some important trends:
- Orthopedics has the most reviews (857,435), showing many patient interactions. But when adjusted for the number of providers, satisfaction varies a lot across the network.
- Urgent Care does well when reviews are adjusted with the highest overall score. However, nearly 20% of reviews are negative, especially about wait times and front-desk service.
- Smaller specialties like Dentistry and Dermatology have fewer reviews but show more consistent patient satisfaction across providers.
Key Point: Having a lot of reviews doesn’t always mean good quality. It’s important to look at how consistent satisfaction is across all providers.
How Different Roles Perform
- Best scores: Staff and doctors in Orthopedics and Surgery do very well (around 4.6–4.8 out of 5). Physician assistants score highest in Primary Care and Orthopedics.
- Average scores: Nurses score well in Surgery and Urgent Care but are low in Dentistry. Practice environments are best in Orthopedics and Ophthalmology but poor in Ob-Gyn.
- Areas needing improvement: Management and wait times score low overall, especially in Dermatology, Family Medicine, and Ob-Gyn. Billing transparency is a common problem, particularly in Dermatology and Primary Care.
Patient Feedback Highlights
- Top specialties: Orthopedics, Dentistry, and Dermatology get mostly positive reviews, especially for staff and nursing.
- Challenges: Urgent Care has many negative reviews due to long waits and poor front-desk experiences. Family Medicine and Primary Care also get complaints about management, wait times, and billing.
What Should Be Done?
- Make high-volume specialties more consistent: Standardize practice operating procedures in Orthopedics and Urgent Care to reduce variations in patient experience.
- Cut down wait times: Use digital check-ins and real-time updates in Urgent Care and OB-GYN to make visits faster and more transparent.
- Fix administrative issues in some specialties: Improve billing clarity, management, and front-desk service in Family Medicine, Primary Care, and Dermatology.
- Support dental nurses: Provide enhanced training for nurses in Dentistry to improve patient care.
- Keep top specialties strong: Use Orthopedics and Surgery as benchmarks and share their best practices with other departments.
Conclusion
While clinical skill and treatment remain essential, patient satisfaction is also strongly influenced by billing clarity, wait times, and administrative efficiency. Empathy and trust are just as important as medical care. Long waits, unclear bills, and poor office management hurt patient experience, especially in Primary Care and Family Medicine. Specialties like Orthopedics, Surgery, and Dermatology perform well by balancing good care with smooth operations. To improve, healthcare providers must maintain strong clinical care while improving service throughout the patient journey. Specialties that perform well in both areas set the example for sustainable growth.
The future of healthcare relies on delivering care that is skilled, compassionate, and well-organized to build lasting patient trust and satisfaction.
References
- RepuGen (A healthcare reputation management platform) Database.
- RepuTally (A review audit tool for medical practices) Database.
- “Patient experience in 2024: Bridging the gap in patient care journeys”: Press Ganey Blog.