
Tap play to enjoy this article, and don’t forget to subscribe to RepuGen on Spotify for more insightful podcasts!
What Drives Healthcare Choices in the U.S?
Choosing a healthcare provider is one of the most important decisions patients make—one that affects not only access to care but also their trust in the system, out-of-pocket costs, and long-term satisfaction. But what influences these decisions the most? Is it insurance coverage, provider experience, digital convenience, or peer reviews?
To answer this, we conducted a nationwide survey of 545 individuals, analyzing their responses across age, gender, income, region, and device type. The results uncover clear trends: insurance acceptance consistently ranks as the top priority, while factors like online reviews, appointment availability, and communication style vary sharply by demographic.
Understanding these differences is essential for healthcare providers seeking to engage diverse patient populations, improve satisfaction, and build long-term loyalty in an increasingly competitive, patient-driven market.
Methodology
This report is based on a nationwide survey of 545 respondents conducted in June 2025. The survey was designed to capture a diverse range of perspectives on how patients in the United States choose their healthcare providers. Included were both multiple-choice and open-ended questions focused on decision-making factors, research behaviors, satisfaction drivers, and demographic influences.
Respondents were segmented across five key demographic categories:
- Age (18–29, 30–44, 45–60, 60+)
- Gender (Male, Female)
- Household Income (ranging from under $10,000 to over $200,000 annually)
- Region (based on U.S. Census Bureau classifications)
- Device Type Used to Access Survey (e.g., Android, iOS, PC)
While sample sizes for most groups were robust, a few device categories (notably PC users) had small sample sizes. In these cases, insights should be interpreted as directional rather than statistically representative.
By combining quantitative analysis of structured responses with qualitative insights from open-ended feedback, this report delivers a comprehensive view of how U.S. patients make healthcare choices—and how those choices are shaped by who they are and how they access care.
Disclaimer: Some groups in this analysis have a small sample size. Results for these groups shouldn’t be considered conclusive, but they may provide a general sense of the trends.
Section A: Demographic-Based Analysis
Age-Based Insights
| Age Group | Percentage Who Researched Most Important Factor When Choosing Provider | Most Important Factor When Choosing | Average Time Spent Researching | Patient Loyalty (% Very Likely to Return) | Avoided Provider Due to Bad Reviews (%) |
|---|---|---|---|---|---|
| 18-29 | 78.13% of patients in this group actively researched their healthcare provider before making a choice. | The top priority was insurance acceptance (28%), indicating that cost coverage is crucial for younger adults. | Most spent between 30 minutes and 1 hour researching (40.00%), showing a moderate level of effort in decision-making. | Only 30.67% were very likely to return to the same provider, reflecting lower loyalty among younger patients. | A high 82.67% avoided providers due to bad online reviews, highlighting the importance of reputation for this group. |
| 30-44 | 80.09% conducted research before selecting a provider, slightly higher than the youngest group. | Insurance remained most important (29.94%), emphasizing continued concern about coverage and costs. | Most spent 1 to 2 hours researching (33.90%), showing increased time investment compared to younger adults. | Loyalty rose to 66.67%, indicating stronger satisfaction or commitment to chosen providers. | 78.53% avoided providers with bad reviews, confirming that online reputation heavily influences choices. |
| 45-60 | The highest research rate at 86.70%, reflecting careful consideration among middle-aged adults. | This group valued both provider credentials and insurance acceptance (22.16%), showing a balance between expertise and cost. | Most spent 2 to 3 hours researching (20.45%), indicating a more thorough evaluation process. | Highest loyalty at 76.70%, suggesting strong satisfaction and provider commitment. | 80.11% avoided providers with poor reviews, emphasizing ongoing sensitivity to reputation. |
| 60+* | Only 72.00% researched their provider, the lowest among all groups, possibly reflecting more reliance on referrals or existing relationships. | Insurance acceptance was most important (38.89%), even more so than other groups, likely due to fixed incomes or Medicare considerations. | Most spent 1 to 2 hours researching (44.44%), showing moderate time spent in decision-making. | Loyalty remained high at 61.11%, reflecting satisfaction, though slightly lower than the 45—60 age group. | This group was less likely to avoid providers due to bad reviews (55.56%), suggesting online reputation has less influence here. |
* Small sample size — interpret with caution
Key Takeaway:
Healthcare providers should adapt their engagement strategies to different age groups. Insurance clarity and easy access to care are important for all patients, but online reputation influences younger and middle-aged patients more strongly.
For adults aged 60 and above, data shows they are less likely to avoid providers because of bad reviews (55.56%). However, online reputation remains important since many older adults rely on caregivers who often check reviews when making healthcare decisions.
Therefore, providers should focus on building trust and strong, lasting relationships with older patients while maintaining a positive online reputation to attract younger audiences. A well-rounded reputation management strategy that considers these age-based differences helps healthcare practices connect effectively with all patients.
Top 5 Weighted Factors in Choosing a Provider – by Age (1–5 Scale)
| Age Group | Insurance Accepted | Cleanliness/Staff | Appointment Availability | Bedside Manner | Credentials |
|---|---|---|---|---|---|
| 18-29 | Rated 4.40, indicating this is very important to younger adults but slightly less than older groups. | Scored 4.01, showing younger adults value a clean and welcoming environment. | Rated 4.06, reflecting moderate importance to younger adults balancing convenience. | 3.79, younger adults care somewhat about provider communication and empathy. | Lowest rating here at 3.59, suggesting younger adults are less concerned with formal qualifications. |
| 30-44 | Rated 4.46, showing consistent importance among early middle-aged adults. | 4.13, a slight increase, indicating growing expectations. | 4.11, consistent with the younger group, indicating the need for accessible scheduling. | 4.04, rising importance among middle-aged groups who value personal interaction more. | 3.93, middle-aged adults place more trust in provider expertise. |
| 45-60 | Rated 4.60, reflecting increasing priority in this group. | 4.45, a strong priority for middle-aged patients, emphasizing staff in hygiene and staff professionalism. | 4.39, showing that middle-aged patients place higher importance on timely access to care. | 4.39, showing strong priority, indicating that respectful, compassionate care matters greatly. | 4.33, high importance, showing that experience and qualifications matter significantly. |
| 60+* | Rated highest at 4.89, highlighting that insurance acceptance is the top concern for seniors. | 4.47, similarly high among seniors who prioritize cleanliness highly for comfort and safety. | 4.39, equally important for seniors who often require regular visits. | 4.44, seniors rate bedside manner highly, likely valuing kindness and clear communication. | Highest at 4.56, seniors heavily rely on credentials to ensure quality care. |
| Total Avg | An average score of 4.60 across all age groups confirms it as the leading factor overall. | Overall average 4.22, marking it as a critical factor across all ages. | Average 4.23, underscoring availability as a top concern. | Average 4.13, confirming it as a key factor in patient satisfaction. | Total average 3.93, indicating credentials are important but less prioritized than insurance or cleanliness. |
* Small sample size — interpret with caution
Calculation of Weighted Averages:
The scores in the table represent weighted averages based on survey responses using a 1-to-5 importance scale, where 5 indicates the highest importance. For each factor, each rating was multiplied by the number of respondents who selected it. These products were then summed and divided by the total number of respondents within each age group. This method ensures that the average score accurately reflects the overall importance assigned to each factor by different demographic segments (age groups).
Key Takeaway:
The table reveals clear age-related shifts in priorities—insurance and cleanliness are universally important, but factors like bedside manners and credentials grow in importance with age. Providers should focus on these evolving expectations to better meet the needs of different patient groups.
Reasons for Leaving Providers – by Age
Key Insights from the Chart:
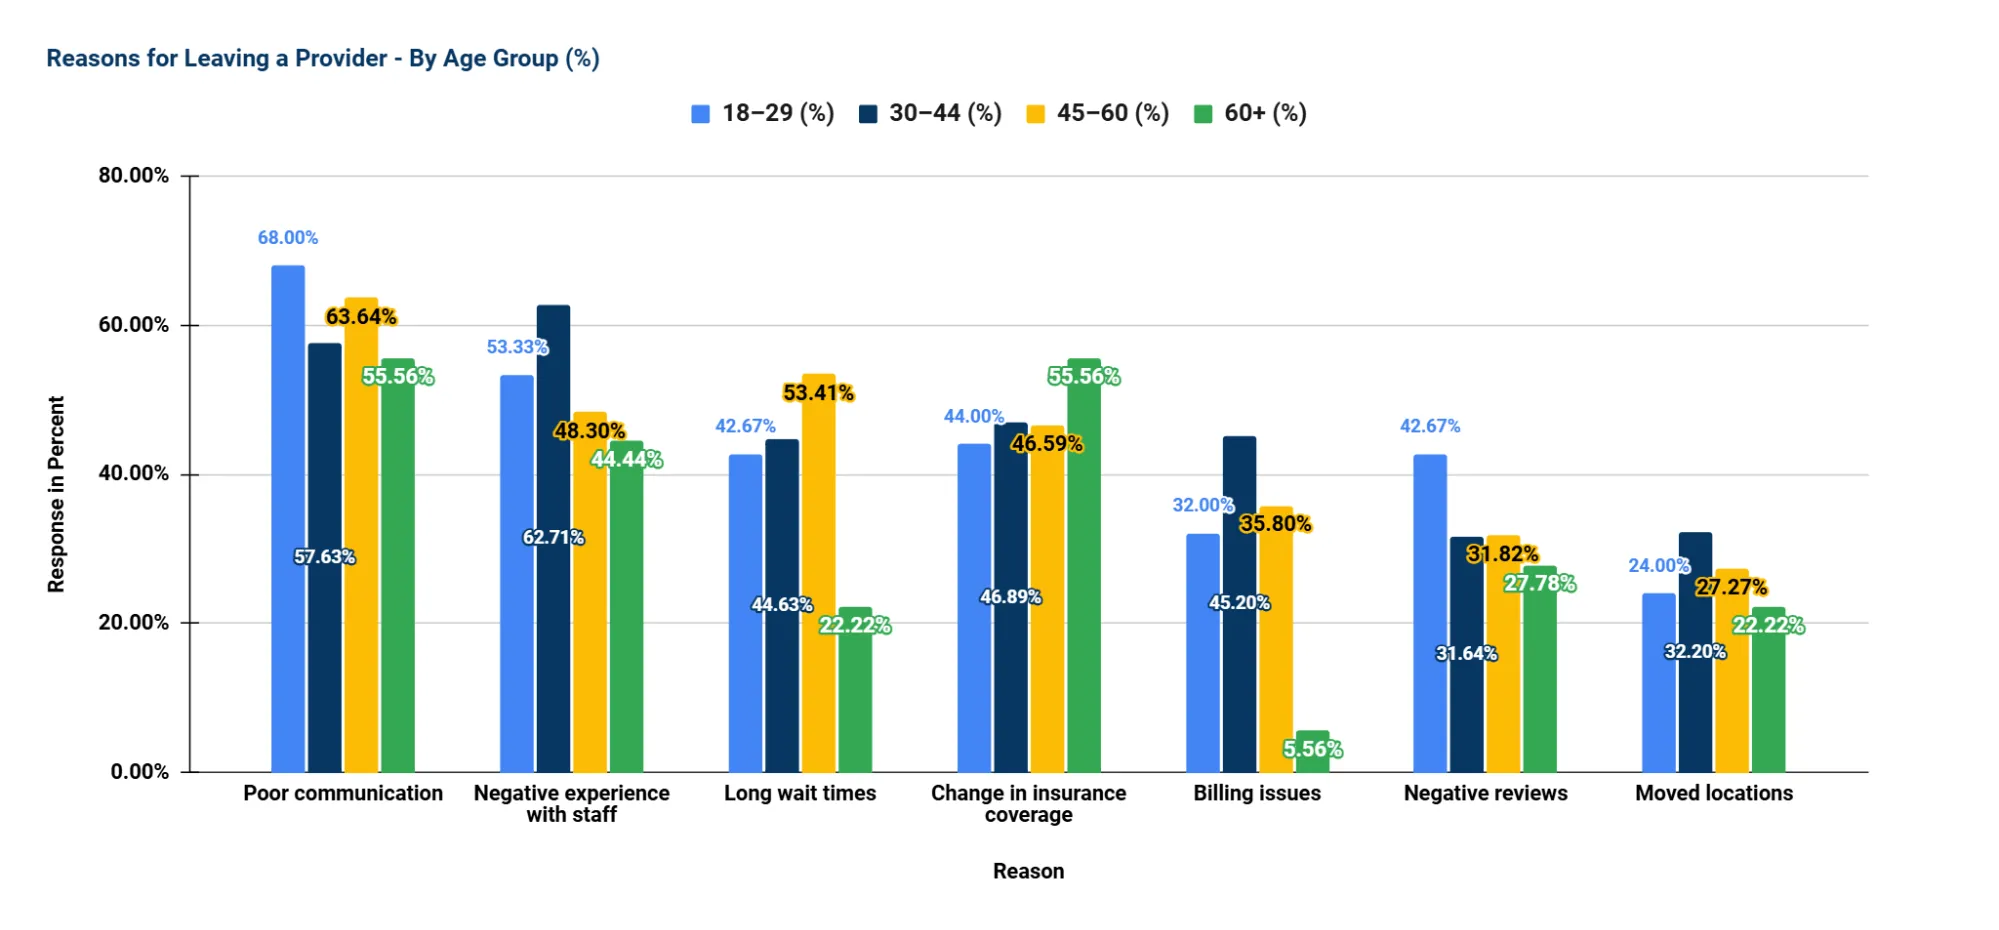
- Doctor–Patient Communication is the Top Reason for Leaving Providers
- Poor communication with doctors is the most cited reason, especially among 18-29-year-olds (68.00%).
- This suggests that younger patients value clarity, responsiveness, and empathy from their healthcare providers, making effective doctor–patient communication essential for retention.
- Staff Interaction Quality Matters More for Adults Aged 30–44 (62.71%)
- Negative experiences with front-desk or support staff are the second most common reason for switching providers overall.
- For the 30-44 age group, respectful, efficient, and friendly non-clinical interactions significantly impact patient satisfaction highlighting the need for customer service training among administrative staff.
- Long Wait Times are a Bigger Issue for the 45–60 Age Group (53.41%)
- While younger and older groups are less affected, long waits are a notable frustration for mid-life adults who likely juggle work, caregiving, and health needs.
- Insurance Coverage Changes are a Major Driver for Seniors (60+) (55.56%)
- This is their top reason for switching providers, reflecting reliance on stable, affordable coverage (e.g., Medicare or Medicare Advantage plans).
- Emphasizes the importance of transparent insurance communication and support in navigating changes.
- Billing Issues Impact Younger and Middle-aged Adults More
- Especially notable in the 30–44 group (45.2%), while very few seniors (5.56%) cite it.
- Indicates a need to improve billing clarity and support, especially for patients navigating employer-based or marketplace plans.
- Negative Online Reviews Influence Younger Adults More
- 42.67% of the 18–29 group cited this reason, dropping significantly with age.
- This underscores the importance of online reputation management, particularly when engaging younger demographics.
- Moving Locations is a Less Common but Still Notable Factor (28.48% overall)
- More common among younger and middle-aged adults, possibly reflecting more frequent life transitions (job changes, relocations, etc.).
Key Takeaway:
Across age groups, the most common reasons for switching providers are rooted in communication, staff interaction, and operational efficiency (e.g., wait times and billing). While younger patients are more influenced by communication quality and online reputation, older adults are driven more by insurance-related changes. These patterns highlight the importance of age-tailored retention strategies, such as investing in staff training, improving communication systems, simplifying billing, and maintaining provider visibility and reputation online.
Interpreting Age-Based Patient Behavior
Understanding how different age groups choose and evaluate healthcare providers is essential to delivering patient-centered care. Our analysis reveals clear generational trends that can guide more effective engagement, retention, and marketing strategies.
- Younger adults (18–29), on the other hand, are significantly more digitally driven. They are highly responsive to online reviews and reputation, and more willing to switch providers based on negative experiences or even perceived inconvenience. Convenience, digital access, and patient-centered communication matter greatly to this group.
- Middle-aged adults (30–60) demonstrate a balanced approach, valuing both modern, digital touchpoints like reviews and online scheduling, as well as traditional expectations such as provider credentials and bedside manner. This group is navigating busy lives — often managing both their own care and that of others — and expects a blend of accessibility, trust, and quality.
- Older adults (60+) tend to show higher loyalty and are strongly influenced by credentials, insurance acceptance, and a general sense of institutional trust, which often includes cleanliness, professionalism, and the familiarity of location. These patients often prefer established providers and traditional referral paths, placing less emphasis on online reviews.
Strategic Implications for Healthcare Providers
To effectively meet the expectations of different age groups, healthcare organizations should consider the following strategies:
- Tailor Messaging by Age Group
- For patients 45 and older, emphasize your years of experience, insurance partnerships, and trustworthiness. Clear communication about provider qualifications and institutional reliability can strengthen their loyalty.
- For younger patients under 45, focus on digital accessibility, responsive communication, and positive online reviews. These elements heavily influence their provider choices.
- Invest in Staff Professionalism and Cleanliness
- Across all age groups, the cleanliness of the facility and staff behavior are consistently rated as top priorities. These are relatively controllable factors that significantly shape the patient experience.
- Prioritize Appointment Availability
- Long wait times and difficulty scheduling are major pain points for all ages, especially middle-aged and working adults. Streamlining access through better scheduling systems and shorter wait times can directly reduce patient churn.
- Strengthen Digital Presence and Reputation
- Younger and middle-aged adults rely heavily on online reviews when selecting or avoiding providers. Maintaining an active, well-managed online presence — including prompt responses to reviews and accurate practice information — is critical.
- Train for Soft Skills: Communication and Empathy
- Many patients leave providers not due to medical errors, but because of poor communication, lack of empathy, or staff rudeness. Investing in soft skills training for both clinical and front-desk staff can significantly improve retention and satisfaction.
Gender-Based Insights
| Gender | % Who Researched Provider | Top Decision-Making Factor | Typical Research Time | Loyalty (% Very Likely to Return) |
Avoided Provider Due to Bad Reviews (%) |
|---|---|---|---|---|---|
| Female | 81.54% actively researched providers before making a choice, indicating strong engagement in the decision-making process. | Insurance coverage was the most important factor for 31.32% of female respondents, suggesting that cost and coverage play a major role. | Nearly half (47.17%) spent less than 1 hour researching, showing a preference for quicker decision-making. | 66.04% reported high loyalty, indicating strong satisfaction once a provider meets their expectations. | 78.11% avoided providers with bad reviews, highlighting a strong sensitivity to online reputation. |
| Male | 82.27% also conducted research, slightly more than females, suggesting both genders actively evaluate providers. | Insurance remained the top factor, though only 20.44% cited it as most important, implying a slightly more diverse set of priorities. | The most common time range was 1-2 hours (35.91%), suggesting men may take more time exploring provider options. | Loyalty was slightly lower at 61.88%, indicating a greater likelihood of switching providers. | 80.11% avoided providers due to bad reviews, making them even more reputation-conscious than female respondents. |
Key Takeaway:
Men and women are similarly proactive in researching healthcare providers, with 82.27% of men and 81.54% of women conducting research before making a decision. Both genders show strong engagement in the selection process.
However, research behavior differs slightly: nearly half of women (47.17%) spend less than an hour researching, while men tend to take more time, with 35.91% spending 1–2 hours. This suggests that men may conduct more in-depth comparisons before choosing a provider.
Insurance coverage is the top decision-making factor for both groups, but it carries more weight for women (31.3%) than men (20.4%), pointing to a higher cost sensitivity among female patients.
A more distinct difference appears in loyalty, 66.04% of women are very likely to return to their provider, compared to 61.88% of men, indicating that men may be slightly more open to switching providers.
Online reputation remains highly influential for both genders: 80.11% of men and 78.11% of women avoided providers due to bad reviews. While the difference is small, it highlights that men may be marginally more sensitive to negative online feedback, reinforcing the critical role of online reputation management for all patient groups.
Top 5 Factors in Choosing a Provider - by Gender (by % Selected)
Key Takeaway:
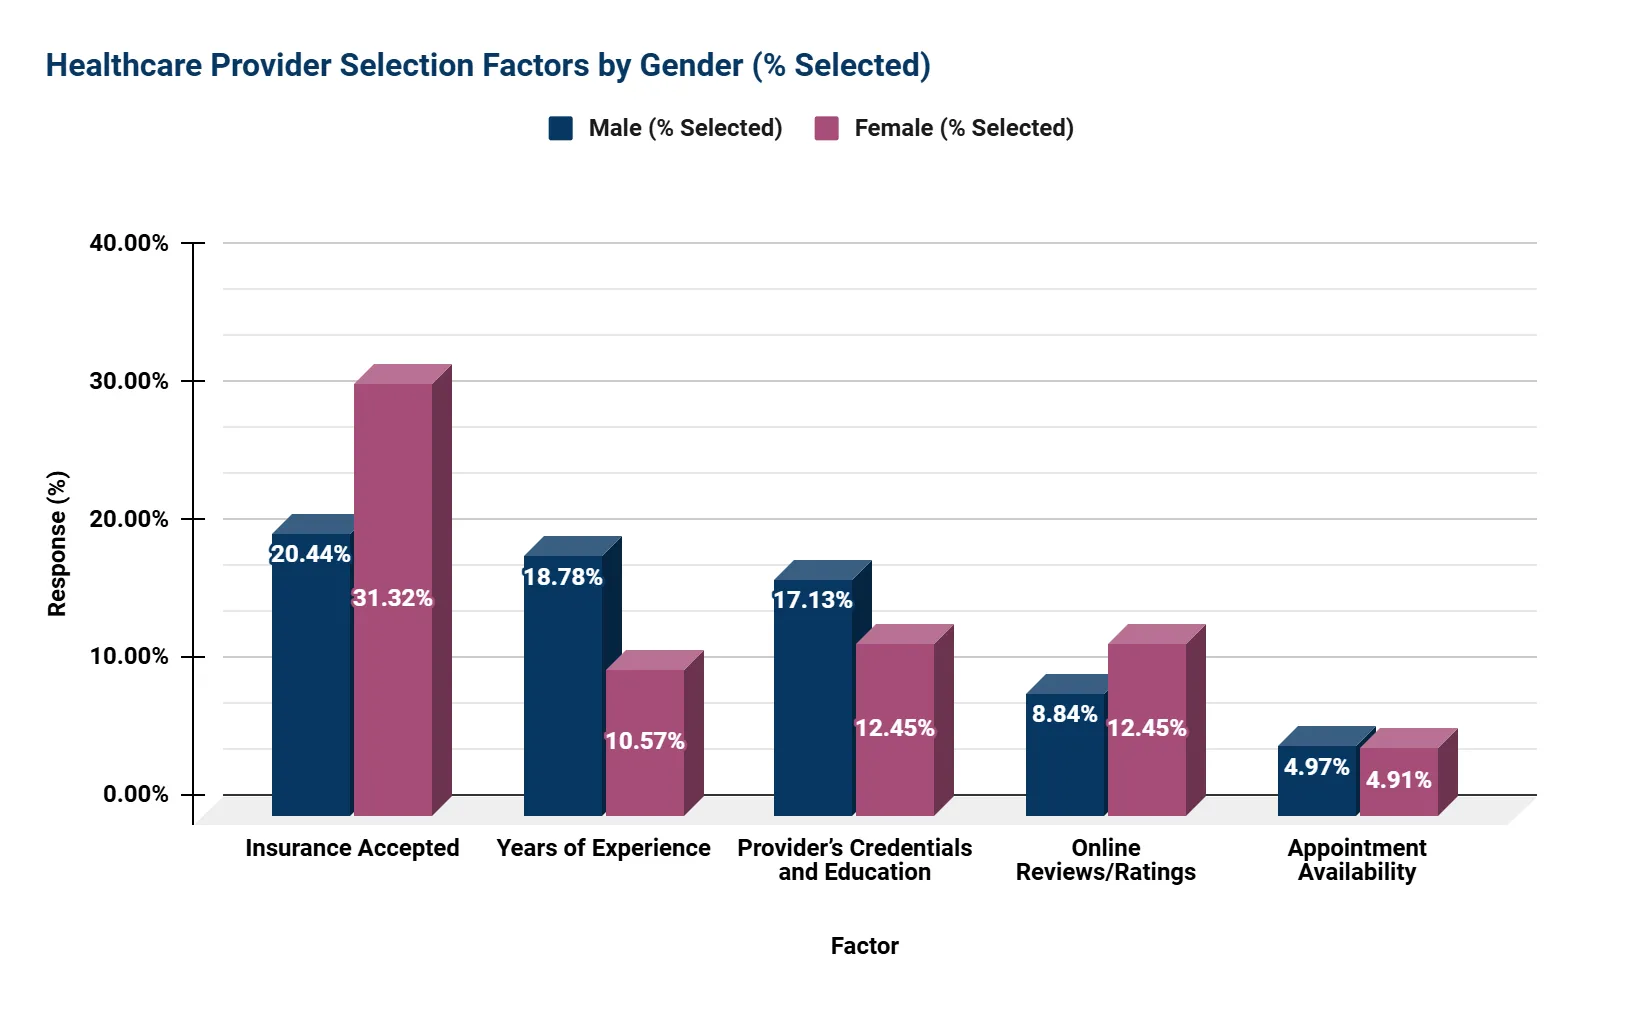
Based on the data in the chart, several differences emerge in what male and female respondents consider important when choosing a healthcare provider.
Insurance accepted is the most commonly selected factor for both men and women, but it holds greater importance for women (31.32%) than men (20.44%). This suggests that women are more focused on whether a provider’s services are covered by their insurance.
Years of experience and provider credentials and education are valued more by men, with 18.78% selecting experience and 17.13% selecting credentials, compared to 10.57% and 12.45% of women respectively. This indicates that men may prioritize the provider’s professional background and expertise more than women do.
Online reviews and ratings show a moderate level of importance and are somewhat more influential for women (12.45%) than men (8.84%). This points to women placing a slightly higher emphasis on feedback from other patients.
Appointment availability is the least selected factor overall, with similar low percentages from men (4.97%) and women (4.91%), suggesting that access to scheduling may not be a primary concern for most respondents in this data set.
In summary, women tend to prioritize insurance acceptance and patient feedback more, while men place relatively more importance on the provider’s experience and credentials. Appointment availability is similarly low in importance for both groups.
Top Dissatisfaction Drivers by Gender
Key Insights from the Gender-Based Dissatisfaction Chart:
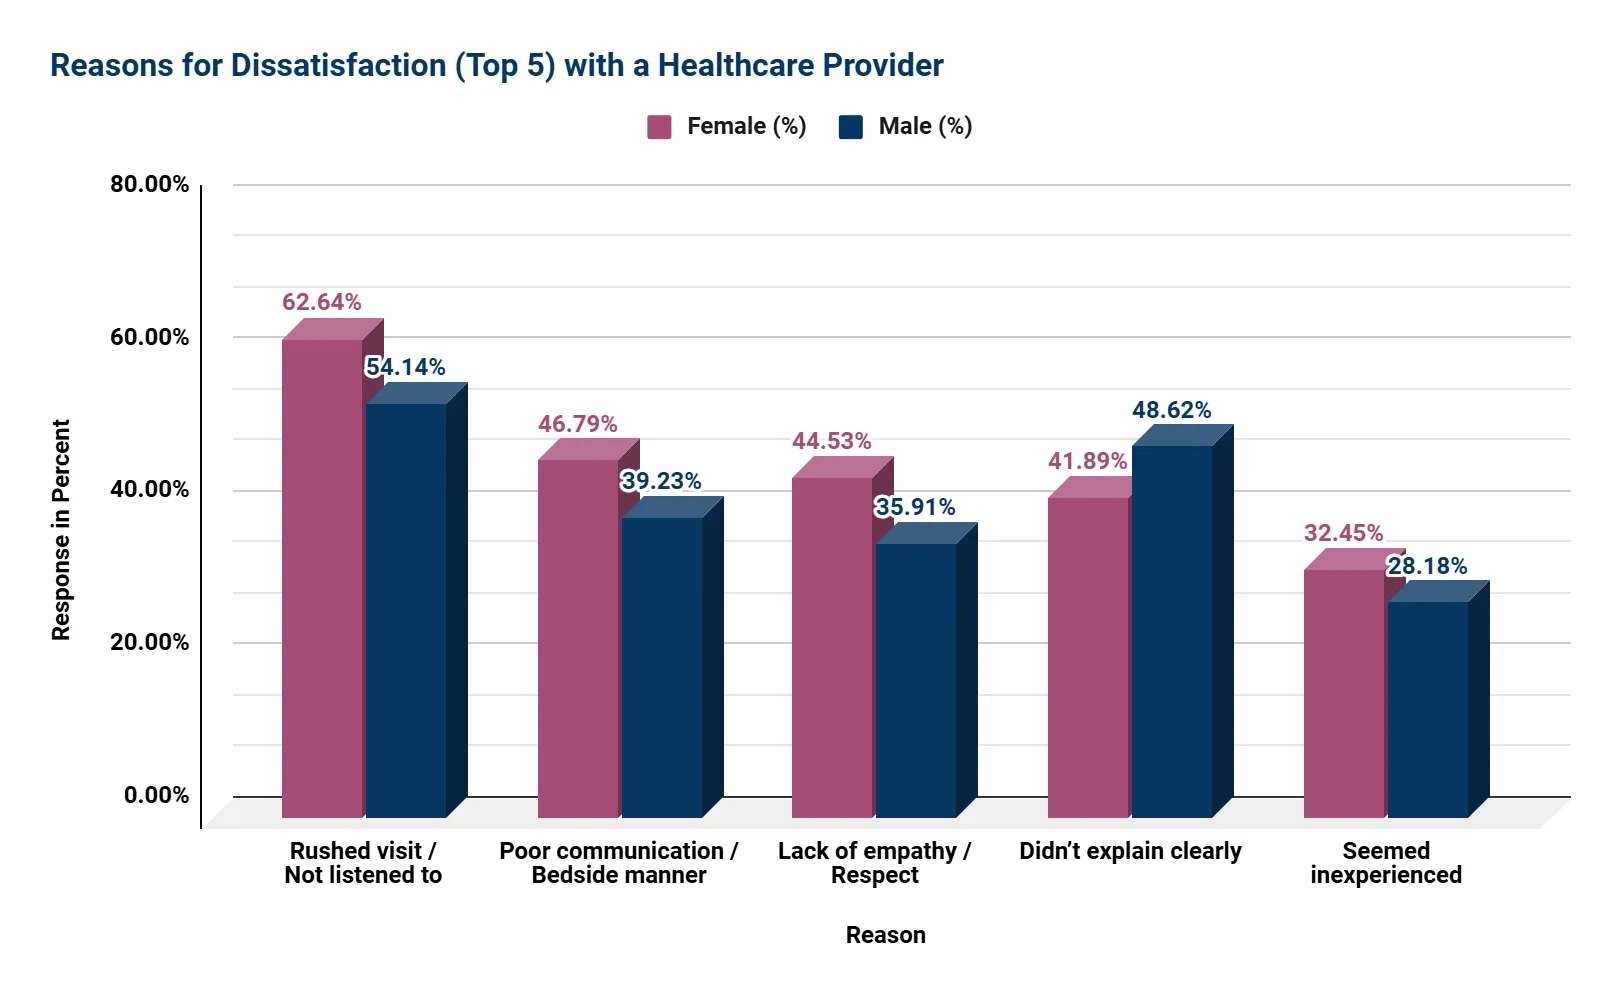
- Women Report Feeling Rushed or Ignored More Often
- 62.64% of female respondents cited rushed visits or not being listened to, compared to 54.14% of men.
- This suggests that women are more sensitive to time quality and feeling heard, emphasizing the need for more patient-centered communication during appointments.
- Communication and Bedside Manner Are Bigger Concerns for Women
- Poor communication or bedside manner was a complaint for 46.79% of women vs. 39.23% of men.
- This reflects that tone, clarity, and respect in provider interactions matter more to women, and when lacking, lead to dissatisfaction.
- Lack of Empathy or Respect Disproportionately Impacts Women
- 44.53% of women reported this issue versus 35.91% of men, indicating that women place greater importance on being treated with dignity and compassion.
- Healthcare providers should focus on being respectful, kind, and attentive, as these qualities make a bigger difference to women’s satisfaction.
- Men Are More Likely to Be Frustrated by Lack of Clarity
- 48.62% of men felt their provider didn’t explain things clearly, higher than the 41.89% of women who said the same.
- This suggests men may prioritize clear, direct explanations about their health conditions or treatments.
- Perceived Inexperience Is a Lesser, But Notable Concern for Both Genders
- While lower overall, 32.45% of women and 28.18% of men noted provider inexperience as a concern.
- This reinforces the importance of demonstrating expertise and clearly communicating qualifications to build trust early in the patient relationship.
Key Takeaway:
While both men and women report dissatisfaction related to communication and provider demeanor, women are more likely to feel unheard, disrespected, or emotionally disconnected during visits. Men, on the other hand, are more affected by a lack of clear information. These insights underline the need for gender-aware communication training, where providers focus on active listening, empathy, and explanation clarity to improve patient satisfaction across the board.
Strategic Implications for Healthcare Providers
- Insurance Coverage Is a Universal Priority
Regardless of gender, insurance acceptance is the top decision-making factor, making it essential to communicate coverage information on all patient-facing platforms. - Maintain a Strong Digital Presence
With nearly 80% of respondents avoiding providers due to bad reviews, online reputation management is no longer optional. Providers must actively monitor, respond to, and encourage patient feedback online. - Customize Communication Approaches
Women place more emphasis on clear, empathetic communication and being heard during visits. Training staff on soft skills and ensuring respectful interactions can significantly improve satisfaction and retention. - Align Messaging with Gender Values
For men, highlight provider credentials, experience, and affiliations in outreach materials. For women, focus more on accessibility, compassion, and personalized service. - Loyalty Is Earned Through Trust
Once a provider builds trust, both genders demonstrate strong loyalty, over 60% of respondents said they are very likely to return. Delivering consistent, high-quality care fosters lasting relationships.
Household Income-Based Insights
| Income Bracket | % Researched Provider | Top Priority | Avg. Time Spent (Most Chosen) | % Very Likely to Return (Loyalty) | Avoided Provider Due to Bad Reviews | Insights |
|---|---|---|---|---|---|---|
| $0-$9,999 | 66.70% | Experience (25%) | 1-2 hrs (25%) | 41.70% | 75.00% | Lower-income patients rely more on provider experience but show less research engagement and lower loyalty. |
| $10k-$24,999 | 78.90% | Insurance (29.3%) | 1-2 hrs (26.8%) | 65.90% | 63.40% | Insurance is a strong priority; patients in this group are more loyal |
| $25k-$49,999 | 74.00% | Insurance (32.4%) | 1-2 hrs (29.6%) | 59.20% | 70.40% | Shows similar priorities as the previous group, but slightly lower loyalty and higher time investment in research. |
| $50k-$74,999 | 81.30% | Insurance (26.9%) | 1-2 hrs (46.2%) | 53.80% | 73.10% | This middle-income group is highly research-oriented, but loyalty is more tentative. |
| $75k-$99,999 | 82.50% | Insurance (40.4%) | 1-2 hrs (25%) | 71.20% | 75.00% | Strong preference for insurance acceptance and higher-than-average loyalty. |
| $100k-$124,999 | 91.80% | Insurance (25%) | 1-2 hrs (37.5%) | 69.60% | 82.10% | Highly informed and digitally engaged, sensitive to insurance and online reviews. |
| $125k-$149,999 | 93.90% | Credentials (27.9%) | 2-3 hrs (27.9%) | 78.70% | 95.10% | Prioritizes professional qualifications and shows very high review sensitivity and loyalty. |
| $150k-$174,999 | 90.30% | Experience (21.4%) | 1-2 hrs (39.3%) | 71.40% | 100.00% | Experience-driven group that fully avoids poorly reviewed providers—100% review sensitivity. |
| $175k-$199,999* | 100.00% | Experience (26.1%) | 2-3 hrs (34.8%) | 60.90% | 82.60% | This group conducts the most research and values deep expertise, but loyalty is moderate. |
| $200k+* | 68.80% | Insurance & Experience (27.3% each) | 1-2 hrs (36.4%) | 81.80% | 63.60% | Surprisingly low research rate for a high-income group; however, they are highly loyal once committed. |
* Small sample size — interpret with caution
Key Takeaway:
Income levels shape how patients search for providers, what they prioritize, and how loyal they remain.
- Lower-income patients focus on insurance and access.
- Middle-income groups balance affordability with reputation and convenience.
- Higher-income individuals prioritize expertise, credentials, and online reviews, and are more selective and reputation-aware.
For healthcare providers, this means:
- Clear insurance info and financial transparency are essential across most brackets.
- Online reviews must be actively managed, especially for mid-to-high-income audiences.
- Tailor messaging: Emphasize accessibility and affordability for lower-income patients, and highlight credentials, experience, and reputation for higher earners.
Top-Ranked Factors by Income Group (Based on Weighted Average on a 1–5 Importance Scale)
| Factor | Highest Scoring Income Group | Weighted Avg Score | Explanation |
|---|---|---|---|
| Appointment Availability | $200k+* | 4.80 | High-income patients place the greatest emphasis on ease and speed of scheduling, reflecting a demand for convenience and time efficiency. |
| Insurance Accepted | $150k–$174k | 4.63 | Even among affluent groups, insurance acceptance remains crucial, suggesting that financial prudence still influences healthcare decisions. |
| Cleanliness & Staff | $125k–$149k | 4.56 | Patients in this income group value a well-maintained environment and professional staff, viewing it as a proxy for quality care and trustworthiness. |
| Credentials & Education | $125k–$149k | 4.38 | This group highly values provider qualifications, reflecting a preference for expertise, advanced training, and perceived competence. |
| Bedside Manner | $75k–$99k | 4.27 | Mid-to-upper income patients place strong value on empathetic, respectful communication, indicating that patient experience matters beyond technical skill. |
| Online Reviews | $100k–$149k | 4.03 | Online reputation is a significant factor for this group, which tends to research thoroughly and rely on peer feedback before committing to a provider. |
* Small sample size — interpret with caution
Key Takeaway:
Patient priorities in choosing a healthcare provider shift notably across income levels, but some core expectations remain consistent. Insurance acceptance, appointment availability, and provider credibility are valued across the board, though the emphasis placed on each varies by income bracket.
Higher-income patients are more selective, spending more time researching and placing greater weight on convenience, credentials, and online reviews. Middle-income groups strike a balance between cost, access, and empathetic care, while lower-income patients tend to focus more on insurance coverage and provider experience, often due to limited access or financial constraints.
Across all groups, digital reputation and perceived trustworthiness (through staff behavior, cleanliness, and bedside manner) emerge as critical drivers of decision-making. This suggests that while clinical competence is expected, experience and trust are what truly influence choice and loyalty.
Time Spent Researching - Distribution by Income Group (% Selected)
$175k–199,999*
$200k+*
* Small sample size — interpret with caution
Key Takeaways:
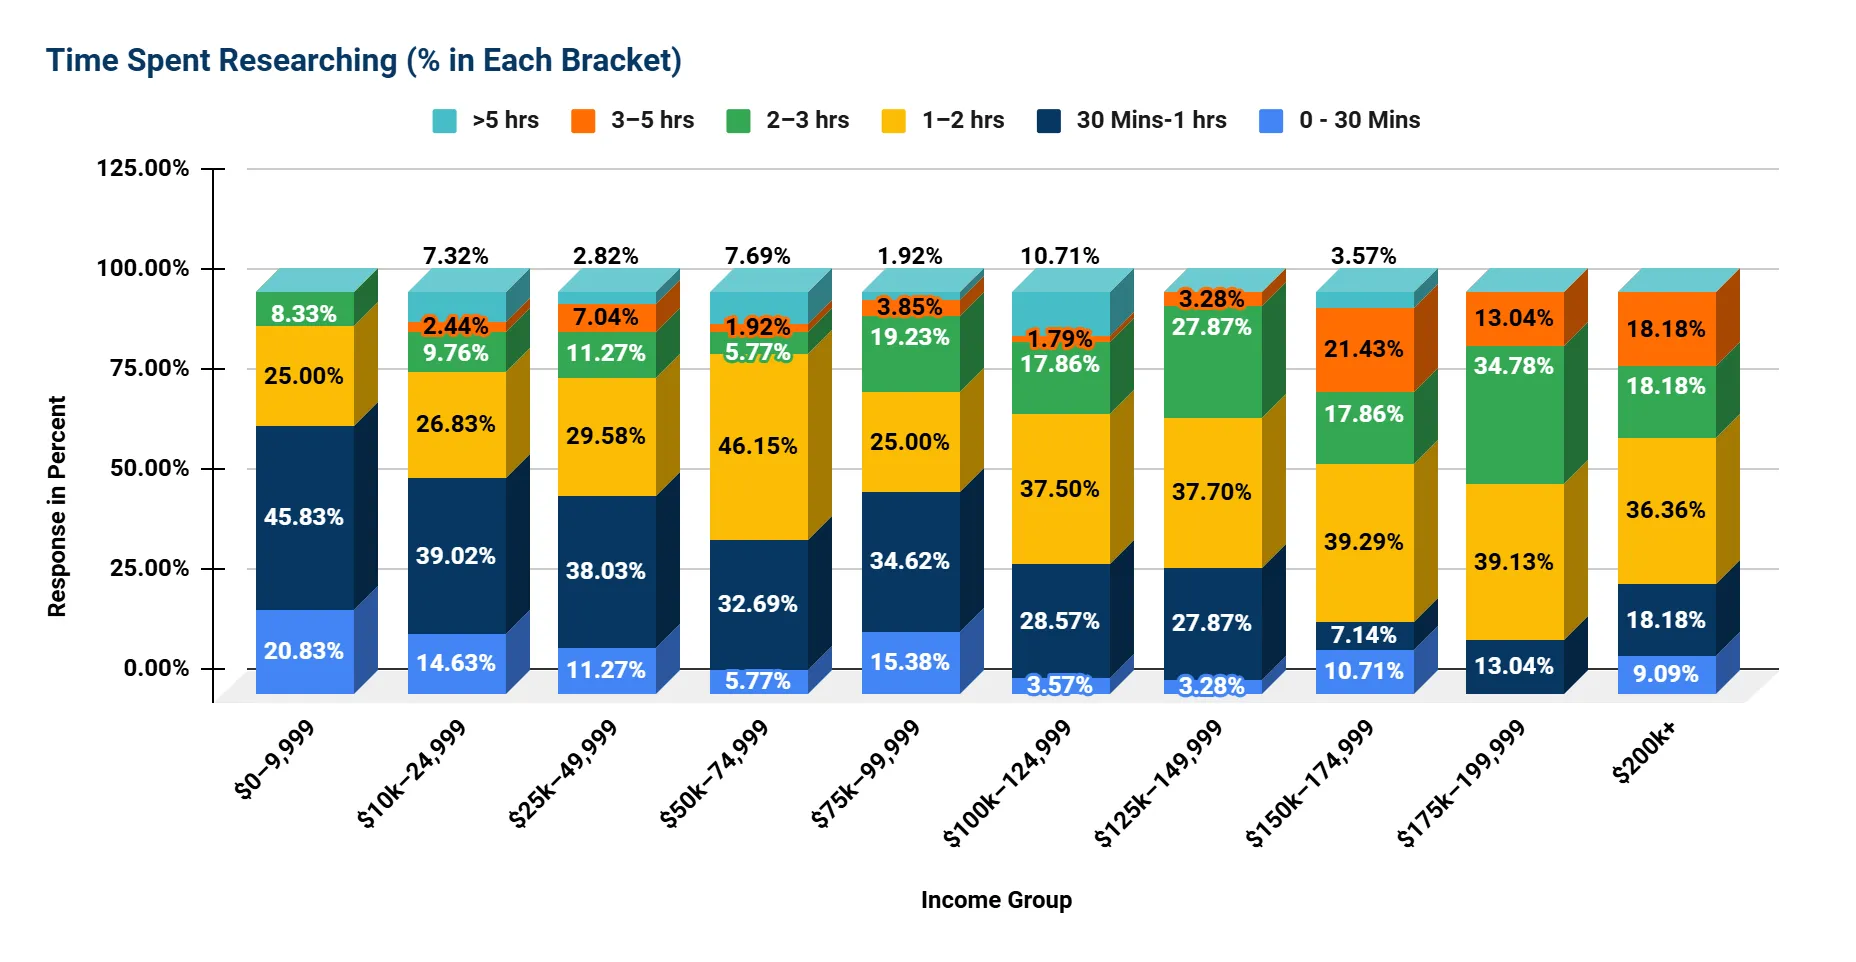
Higher Income = More Research Time Invested
As income rises, patients tend to spend more time researching healthcare providers, with a clear shift toward the 2+ hour brackets among upper-income groups.
Notably:
- 34.78% of those in the $175k–199k* bracket spend 2–3 hours, the highest of any group in that range.
- The $150k–174k and $200k+* brackets show elevated research in the 3–5 hour range (21.43% and 18.18%, respectively).
- The $100k–149k range demonstrates well-distributed engagement across the 1–3 hour brackets, showing consistent and deliberate research patterns.
* Small sample size — interpret with caution
Middle-Income Patterns Are Varied
Research time in middle-income groups (roughly $50k–99k) is more diverse, with a noticeable emphasis on the 1–2 hour range but less consistency beyond that.
Examples:
- 46.15% of the $50k–74k group spend 1–2 hours, the highest of any group in that time bracket.
- The $75k–99k bracket shows a more mixed pattern, with 25.00% spending 1–2 hours and 19.23% spending 2–3 hours.
- These groups may balance effort with time/resource limitations, aiming to be informed without over-investing.
Lower-Income = Shorter Research Time
Respondents in the lowest income brackets generally spend less time researching providers, with minimal representation beyond the 2-hour mark.
In Detail:
- In the $0–9,999 group, 66.66% spend less than 1 hour, and only 8.33% reach the 2–3 hour range.
- The $10k–24,999 group mirrors this with 53.65% spending less than 1 hour.
- These trends may reflect limited digital access, fewer provider choices, or more reliance on insurance networks rather than research.
Upper-Middle Incomes Show Intentional, Balanced Research
The $125k–149k group stands out for balanced engagement:
- Nearly 38% spend 1–2 hours, and another 28% spend 2–3 hours.
- This segment appears highly methodical, allocating more time to research without excess.
Research Peaks at 2-3 Hours, Regardless of Income
Across nearly all brackets that show substantial research engagement, 2–3 hours emerges as the most common "deep research" range before tapering off.
Examples:
- $125k–149k: 27.87% in 2–3 hrs
- $100k–124k: 17.86% in 2–3 hrs
- $150k–174k: 17.86% in 2–3 hrs
- $200k+*: 18.18% in 2–3 hrs
Minimal >5-Hour Research Overall
Very few respondents spend more than 5 hours researching providers, suggesting a natural upper limit on research intensity even among the most engaged patients.
- Highest was $100k–124k with 10.71% spending over 5 hours, but this is an outlier.
* Small sample size — interpret with caution
Top 5 Patient Dissatisfaction Reasons by Income Group
| Income Group | Reason #1 | Reason #2 | Reason #3 | Reason #4 | Reason #5 |
|---|---|---|---|---|---|
| $0–$9,999 | Rushed visit / Not listened to | Poor communication / Bedside manner | Didn't explain clearly | Lack of empathy / Respect | Inexperienced or Unknowledgeable |
| $10k–$24,999 | Rushed visit / Not listened to | Didn't explain clearly | Poor communication / Bedside manner | Lack of empathy / Respect | Long wait times |
| $25k–$49,999 | Rushed visit / Not listened to | Didn't explain clearly | Poor communication / Bedside manner | Lack of empathy / Respect | Long wait times |
| $50k–$74,999 | Rushed visit / Not listened to | Didn't explain clearly | Poor communication / Bedside manner | Long wait times | Inexperienced or Unknowledgeable |
| $75k–$99,999 | Rushed visit / Not listened to | Poor communication / Bedside manner | Lack of empathy / Respect | Didn't explain clearly | Inexperienced or Unknowledgeable |
| $100k–$124,999 | Rushed visit / Not listened to | Didn't explain clearly | Poor communication / Bedside manner | Lack of empathy / Respect | Rude or unprofessional staff |
| $125k–$149,999 | Rushed visit / Not listened to | Didn't explain clearly | Long wait times | Rude or unprofessional staff | Poor communication / Bedside manner |
| $150k–$174,999 | Rushed visit / Not listened to | Didn't explain clearly | Lack of empathy / Respect | Poor communication / Bedside manner | Unclean / Uncomfortable environment |
| $175k–$199,999* | Rushed visit / Not listened to | Didn't explain clearly | Long wait times | Poor communication / Bedside manner | Rude or unprofessional staff |
| $200k+* | Rushed visit / Not listened to | Didn't explain clearly | Poor communication / Bedside manner | Lack of empathy / Respect | Long wait times |
| No Answer | Rushed visit / Not listened to | Didn't explain clearly | Poor communication / Bedside manner | Lack of empathy / Respect | Long wait times |
* Small sample size — interpret with caution
Key Takeaways:
- The top reason for dissatisfaction across all income levels is that doctors don’t listen or rush visits, highlighting a universal need for better patient communication and attention.
- Poor communication, unclear explanations, and lack of empathy are common issues affecting patients regardless of income, underscoring the importance of compassionate care.
- Lower-income groups are particularly sensitive to respect and emotional connection during visits.
- Higher-income groups place more emphasis on office environment and staff professionalism, reflecting higher expectations for the overall patient experience.
- Long wait times are a frequent source of frustration across income brackets, though slightly less prominent among the highest earners.
Interpretation of Results (Income-Based)
The data reveals distinct patterns in healthcare provider selection across income groups. Middle-to-upper income households adopt a more deliberate and comprehensive approach, investing greater time in research, consulting multiple sources, and placing significant importance on provider credentials and affiliations. Conversely, lower-income groups prioritize affordability and insurance acceptance, reflecting financial constraints and more limited provider options.
Interestingly, respondents with incomes exceeding $200,000 occasionally place less emphasis on factors such as office location and cleanliness. This trend may be attributed to greater flexibility in scheduling, enhanced insurance benefits, or access to concierge-style care.
Across all income levels, online reviews and digital presence significantly influence decision-making, with a particularly strong impact on higher-income individuals. This underscores the growing importance of online reputation in healthcare provider selection.
Strategic Implications for Healthcare Providers
- Insurance Compatibility Is Fundamental:
Accepted insurance plans are the foremost concern for patients at all income levels. Providers must prominently communicate which plans they accept to avoid losing potential patients. - Digital Visibility is Crucial:
With heavy reliance on review platforms and search engines, especially among middle- and higher-income groups, proactive management of digital reputation is essential to attract and retain patients. - Credentials and Experience Are Key Differentiators:
Higher-income patients are drawn to providers who highlight their education, professional experience, and affiliations. These credentials should be prominently showcased on websites and marketing materials. - Operational Efficiency Drives Patient Loyalty:
Long wait times, billing difficulties, and negative staff interactions contribute to patient attrition. Streamlining these operational aspects is vital to maintain satisfaction across all income segments. - The Personal Touch Remains Important:
Bedside manner and clear communication continue to be common sources of dissatisfaction. Ongoing staff training focused on empathy and patient interaction is necessary. - Tailored Strategies by Income Segment:
Marketing, care delivery, and communication should be customized: emphasize cost and insurance compatibility for lower-income audiences, while highlighting prestige, service quality, and provider credentials for higher-income groups.
Region-Based Insights
| Region | % Who Researched Provider | Most Important Factor Influencing Provider Choice (with %) | Average Time Spent on Research (Most Common Range) | Loyalty (% Very Likely to Return) | Avoided Provider Due to Bad Reviews (%) |
|---|---|---|---|---|---|
| Middle Atlantic | 87.70% | Years of Experience (23.94%) | 1–2 hours (28.17%) | 67.60% | 12.70% |
| Pacific | 86.00% | Insurance acceptance (21.09%) | 1–2 hours (37.41%) | 58.50% | 16.30% |
| East North Central | 83.60% | Insurance acceptance (33.33%) | 30 min–1 hour (43.14%) | 66.70% | 35.30% |
| West South Central | 83.00% | Insurance acceptance (38.64%) | 1–2 hours (45.45%) | 54.60% | 20.50% |
| New England* | 80.00% | Credentials & Reviews (combined) (43.75%) | Less than 1 hour (62.50%) | 75.00% | 25.00% |
| South Atlantic | 77.10% | Insurance acceptance (31.91%) | 1–2 hours (40.43%) | 70.20% | 27.70% |
| West North Central | 75.00% | Insurance acceptance (33.33%) | 30 min–1 hour (50.00%) | 66.70% | 20.80% |
| East South Central* | 73.70% | Insurance acceptance & Bedside manner (26.32%) | 30 min–1 hour (28.57%) | 85.70% | 21.40% |
| Mountain | 67.40% | Insurance acceptance (39.39%) | 1–2 hours (39.39%) | 72.70% | 33.30% |
* Small sample size — interpret with caution
Key Takeaway:
Patients prioritize insurance compatibility, with it being the top factor in 7 of 9 regions, ranging from 21.09% to 39.39%. However, provider reputation (e.g., years of experience in the Middle Atlantic at 23.94%) and credentials (25.00% in New England) strongly correlate with higher loyalty rates (67.60% and 75.00%, respectively).
Bedside manners, combined with insurance, drive the highest loyalty (85.70%) in the East South Central. Research time varies regionally from less than 1 hour (62.50%) in New England to 1–2 hours in the Pacific (37.41%) and West South Central (45.45%).
Sensitivity to bad reviews is high in the East North Central (35.30%) and Mountain (33.30%) regions, highlighting the need for tailored strategies focused on insurance clarity, reputation management, and patient experience.
Top 3 Factors Considered When Selecting a Healthcare Provider Across US Regions
| Region | 1st Choice | 2nd Choice | 3rd Choice |
|---|---|---|---|
| East North Central |
Insurance accepted (33.33%)
Cost and coverage are key concerns.
|
Years of experience (13.73%)
Online reviews (13.73%) — Patients value provider expertise and peer feedback equally.
|
Office cleanliness & professionalism (11.62%)
Environment matters for trust and comfort.
|
| East South Central* |
Insurance accepted (26.57%)
Affordability and coverage prioritized.
|
Bedside manner (26.57%)
Personal care and communication are highly valued here.
|
Online reviews (21.43%)
Digital reputation influences decisions.
|
| Middle Atlantic |
Years of experience (23.94%)
Expertise is top priority.
|
Provider's credentials (21.13%)
Formal qualifications matter.
|
Insurance accepted (18.31%)
Coverage is still important, but secondary.
|
| Mountain |
Insurance accepted (39.39%)
The highest insurance priority among all regions.
|
Provider's credentials (15.15%)
Online reviews (15.15%) — Balanced emphasis on qualifications and reputation.
|
Bedside manner (9.09%)
Personal interaction is a lesser but notable factor.
|
| New England* |
Credentials, reviews, and affiliations (25.00%)
Specialized qualifications dominate.
|
Bedside manner / Location (12.50%)
Personal care and convenience also matter.
|
No third factor was strongly noted.
|
| Pacific |
Insurance accepted (21.09%)
Cost and cost-effectiveness important but less dominant.
|
Provider's credentials / Years of experience (15.15%)
Professional background valued.
|
Online reviews (14.29%)
Digital feedback is influential.
|
| South Atlantic |
Insurance accepted (31.91%)
Major deciding factor.
|
Bedside manner / Language / Location (8.51%)
Patient-provider rapport, communication, and convenience.
|
Years of experience (8.51%)
Experience matters, but less so than other factors.
|
| West North Central |
Insurance accepted (33.33%)
Cost and coverage are key.
|
Bedside manner (16.67%)
Personal care valued strongly.
|
Years of experience / Online reviews (12.50%)
Balanced importance of expertise and reputation.
|
| West South Central |
Insurance accepted (38.64%)
Near the top nationally for insurance priority.
|
Provider's credentials (13.64%)
Formal qualifications are important.
|
Years of experience (11.36%)
Experience is also a significant factor.
|
* Small sample size — interpret with caution
Key Takeaways:
- Insurance Acceptance Is the Primary Driver Nationwide
In nearly every region, insurance acceptance tops the list, with percentages ranging from about 21% to nearly 40%. This highlights the critical role of cost coverage and financial accessibility in patient decision-making across the US. - Regional Differences in Emphasis on Provider Expertise and Reputation
Regions like the Middle Atlantic and New England place greater importance on years of experience, credentials, and professional affiliations (up to 25%), suggesting that in these areas, patients may have higher expectations for quality and formal qualifications. Providers here should prominently showcase expertise and certifications. - Personalized Care and Patient Experience Matter More in Some Areas
In the East South Central and South Atlantic regions, bedside manner ranks as the 2nd or 3rd most important factor (around 28.57% and 8.51% respectively), indicating that empathy, communication, and provider-patient rapport heavily influence choice. Healthcare providers in these regions should emphasize compassionate care and communication skills. - Online Reviews Are Increasingly Influential
Digital reputation appears as a key factor in many regions (e.g., East North Central, Mountain, Pacific), reflecting the growing importance of online reviews in shaping patient perceptions and choices. This trend suggests that managing online presence and encouraging positive patient feedback are vital. - Convenience and Environment Play a Smaller but Notable Role
Factors like office cleanliness, professionalism, language, and location appear as 3rd choices in some regions, implying that while these are not top priorities, they still contribute to overall patient satisfaction and decision-making. - Tailored Regional Strategies Are Essential
The variation in priorities across regions underscores the need for customized marketing and patient engagement strategies. For example:- Focus on insurance transparency and affordability in the Mountain and West South Central regions.
- Highlight provider credentials and experience in the Middle Atlantic and New England.
- Emphasize bedside manner and patient communication in the East South Central and South Atlantic.
Factor Importance – Weighted Average Across All Regions
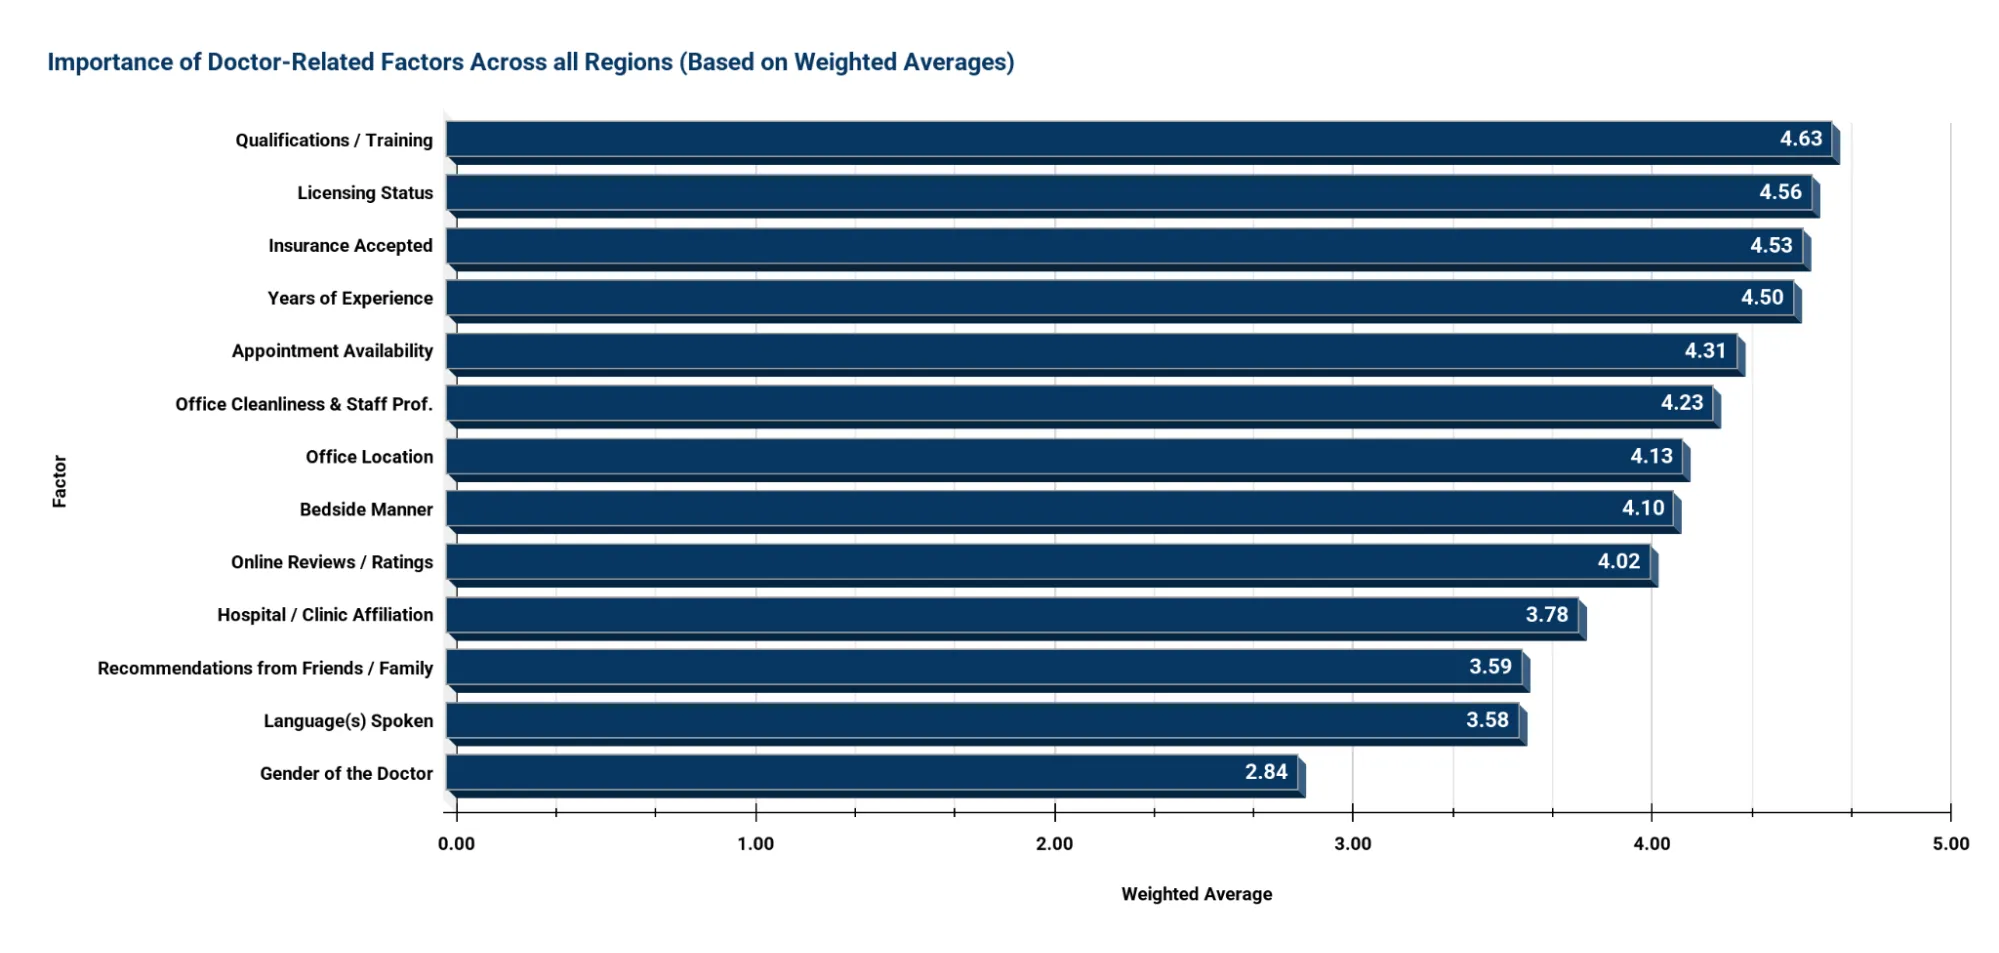
Note: How Weighted Average Was Calculated
Each importance level was assigned a number from 1 to 5:
- Not Important = 1
- Slightly Important = 2
- Moderately Important = 3
- Important = 4
- Very Important = 5
To calculate the weighted average for each factor, the percentage of responses at each level was multiplied by its corresponding value, and then all were added together.
Example – Qualifications/training:
(0.68% × 1) + (0.23% × 2) + (6.38% × 3) + (16.86% × 4) + (76.30% × 5) = 4.63
A higher weighted average means the factor was considered more important overall by respondents.
Key Takeaway:
Patients are highly rational and quality-focused when selecting providers: they want qualified, licensed, experienced professionals who accept their insurance and offer accessible, clean, and professional care. While personal experience (bedside manner) and digital visibility (online reviews) matter, they are secondary to objective indicators of provider legitimacy.
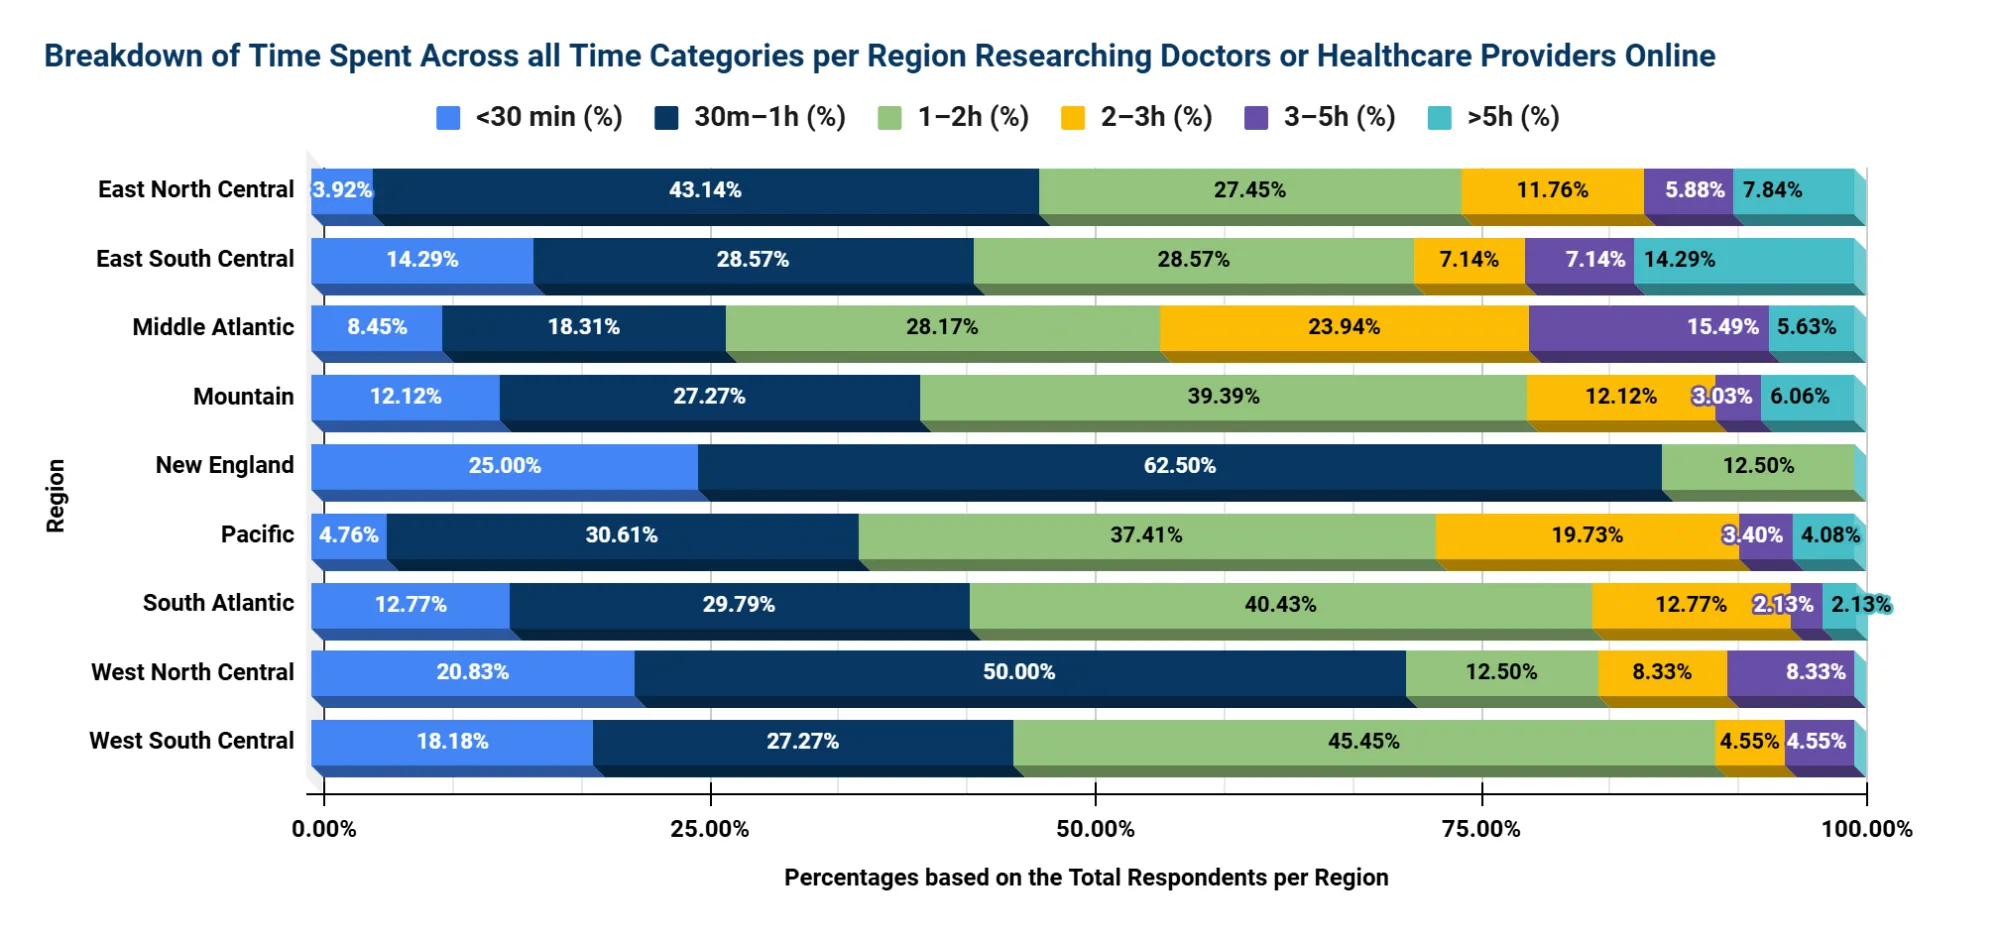
Time Spent Researching – Distribution Across Regions
East South Central*
New England*
* Small sample size — interpret with caution
Key Takeaways:
1. Most Patients Spend Between 30 Minutes and 2 Hours Researching
- 64.92% of all respondents (439) spend 30 minutes to 2 hours researching providers online:
- 30m–1h: 30.98% (136 out of 439)
- 1–2h: 33.94% (149 out of 439)
- This suggests that for the majority of patients, selecting a healthcare provider is a deliberate process, though not overly time-consuming.
2. Time Spent Varies Significantly by Region
- More in-depth researchers (2–5+ hours) are concentrated in:
- Middle Atlantic: 23.94% spend 2–3 hours, and 15.49% spend 3–5 hours — much higher than average.
- Pacific: 19.73% spend 2–3 hours — indicating moderately long research behavior.
- These regions may have more provider options or higher patient standards, driving extended research.
- Quicker decision-making is seen in:
- New England: 87.50% of respondents spend less than 1 hour; 0% spend more than 2 hours.
Note: Based on a small sample (n=8); reflects a general trend, not a definitive percentage. - West North Central: 70.83% spend less than 1 hour.
- These trends may reflect smaller provider pools, lower perceived variability, or greater trust in existing networks.
- New England: 87.50% of respondents spend less than 1 hour; 0% spend more than 2 hours.
3. Low Percentage of Deep Researchers Nationwide
- Only 10.25% of respondents across all regions spend 3+ hours researching (5.92% for 3–5h, 4.33% for >5h).
- This indicates that only a minority dig very deeply, making it vital for providers to stand out in the top-level search experience (e.g., good website, strong reviews, clear info).
4. West South Central Shows Focused Yet Efficient Research
- 45.45% spend 1–2 hours — the highest percentage in this range. Only 4.55% spend more than 3 hours.
- Suggests that patients in this region are committed but efficient in their research approach.
Interpretation of Regional Differences
Digital Behavior & Search Trends
- New England* and East South Central* regions demonstrate higher reliance on search engines during provider selection, prompting more thorough online research.
* Small sample size — interpret with caution
Experience Over Reviews in Traditional Regions
- In regions like the West North Central, “years of experience” and “insurance acceptance” are prioritized more than online reviews, pointing to traditional healthcare preferences and potentially more rural, trust-based decision-making.
Office Environment Remains Universally Important
- Across nearly all regions, office cleanliness and staff professionalism rank high. Despite digital discovery trends, the physical care environment strongly shapes perception and trust.
Cultural Influence on Language & Gender Preferences
- Factors like language and doctor’s gender receive minimal emphasis in New England and South Atlantic, but hold greater relevance in Pacific and Middle Atlantic regions-likely reflecting higher cultural and linguistic diversity.
Strategic Implications for Healthcare Providers
1. Make Insurance Acceptance Highly Visible
- Especially in the West South Central, Mountain, and East North Central*, insurance compatibility is a key decision factor. Ensure:
- Accurate listings on insurance directories.
- Clear visibility of accepted plans on websites and patient-facing materials.
2. Prioritize Digital Reputation Management
- With 78.59% of patients avoiding providers due to bad reviews, a strong online presence is non-negotiable. Focus review-building and response efforts on:
- Middle Atlantic, Pacific, and South Atlantic—regions with the highest sensitivity to reviews.
3. Tailor Regional Messaging Approaches
- Highlight experience and credentials in areas like Middle Atlantic and West North Central, where these factors outweigh reviews.
- Emphasize cleanliness and professional staff in all markets—this is a universal trust driver.
- Limit emphasis on language or gender preferences in regions like New England*, but acknowledge them in diverse regions such as the Pacific or the Middle Atlantic, where they carry more weight.
4. Invest in Retention Through Operational Excellence
- Once patients find a provider they trust, loyalty is high. But poor communication or disorganized operations can lead to churn. Focus on:
- Timely appointments, billing transparency, and positive staff interactions, especially in regions with historically high dissatisfaction.
Device Type-Based Insights
| Device Type | % Who Researched Provider | Top Decision-Making Factor | Typical Research Time | Loyalty (% Very Likely to Return) | Avoided Provider Due to Bad Reviews (%) |
|---|---|---|---|---|---|
| Android |
85.10% of users researched providers
showing strong engagement with healthcare choices.
|
Insurance coverage was key
for 22.58%, highlighting cost as a major concern.
|
1-2 hours for 33.64% of users
suggesting a moderate time investment.
|
69.12% reported strong loyalty
indicating satisfaction with chosen providers.
|
82.49% avoided providers with bad reviews
reflecting high sensitivity to reputation.
|
| iOS |
79.64% conducted research
slightly below Android users, but still a large majority.
|
Insurance coverage led
for 31.39%, suggesting affordability is top of mind.
|
Under 1 hour for 47.96%
showing more efficient decision-making tendencies.
|
59.19% expressed loyalty
suggesting more openness to switching providers.
|
75.34% avoided poorly reviewed providers
still showing strong review awareness.
|
Key Takeaways:
- Mobile dominates: Users are much more likely to use Android (85.10%) and iOS (79.64%) devices than desktop when searching for healthcare
- Insurance is top priority: Especially for mobile users, most cite it as the key decision factor.
- iOS users decide faster:98% spend less than 1 hour researching, but show lower loyalty (59.19%).
- Android users are more loyal: Higher loyalty (69.12%) and more sensitive to bad reviews (82.49%).
- Bad reviews matter:92% of users (352 out of 446 respondents) across all devices avoided providers because of poor reviews.
- Desktop insights limited: Very small sample sizes, but hint that desktop users prioritize credentials (Windows) or bedside manner (Mac).
Top Weighted Factors When Choosing a Provider - by Device (1-5 Scale)
Weighted Average Importance (1 = least important, 5 = most important)
| Factor | Android (Avg. User Priorities) | iOS (Avg. User Priorities) |
|---|---|---|
| Insurance Accepted |
4.51
Very important, top concern for most Android users.
|
4.53
The most important factor for iOS users as well.
|
| Office Cleanliness |
4.36
Strong hygiene expectations.
|
4.13
Moderately important.
|
| Appointment Availability |
4.27
Timeliness matters.
|
4.16
Slightly less critical.
|
| Office Location |
4.20
Location convenience matters.
|
3.99
Less important than for Android users.
|
| Credentials |
4.18
Background matters.
|
3.92
Less concerned with credentials.
|
| Bedside Manner |
4.20
Patient experience valued.
|
4.09
Also important, but less so than Android.
|
| Online Reviews |
4.15
Reviews carry weight.
|
3.93
Slightly less influenced by them.
|
| Language Spoken |
3.76
Language accessibility is somewhat important.
|
3.37
Less important.
|
| Gender of Doctor |
3.11
Generally not a high priority.
|
2.66
Least important to iOS users.
|
| Medical School Attended |
3.74
Moderately important.
|
3.02
Low emphasis.
|
| Recommendations |
3.76
Peer input is somewhat influential.
|
3.34
Lower priority.
|
How Weighted Averages Were Calculated:
| Each response option is assigned a numerical weight | Response Option Weight |
|---|---|
| Not important | 1 |
| Slightly important | 2 |
| Moderately important | 3 |
| Important | 4 |
| Very important | 5 |
Calculation Method:
- Multiply the number of responses at each level by its corresponding weight.
- Add all the weighted values together.
- Divide the total by the number of respondents for that factor.
This provides the weighted average, indicating the overall importance rating for each factor.
Key Takeaways:
Insurance Accepted is the Top Priority for All Mobile Users
It received the highest average rating from both Android (4.51) and iOS users (4.53), clearly ranking as the most important factor when choosing a healthcare provider.
Android Users Prioritize More Factors Than iOS Users
Android users consistently rated more factors above 4.0, suggesting a broader set of priorities in provider selection.
- Cleanliness (4.36), appointment availability (4.27), bedside manner (4.20), and credentials (4.18) were all rated higher by Android users than by iOS users.
- iOS users showed a more focused preference, with fewer factors above 4.0 and lower ratings overall across most categories.
Location and Timeliness Matter More to Android Users
- Android users rated office location at 4.20 vs. iOS at 3.99.
- Appointment availability was also rated higher by Android users (4.27) compared to iOS (4.16), indicating greater emphasis on access and convenience.
Online Reviews Influence Android Users More
Android users gave online reviews an average score of 4.15, compared to 3.93 for iOS users, showing they are more likely to rely on digital reputation when evaluating providers.
Language and Recommendations Are Moderate Priorities - Especially for Android
- Language spoken was more important to Android users (3.76) than iOS users (3.37).
- Recommendations followed a similar pattern: Android (3.76) vs. iOS (3.34), showing Android users may value peer input and accessibility slightly more.
Gender of Doctor is the Least Important Factor for Both
- This factor received the lowest ratings overall, especially among iOS users (66), confirming that a provider’s gender is generally not a major concern.
Medical School Attended Is Low Priority, Especially for iOS
- Android users rated it 74, while iOS users gave it just 3.02, indicating limited influence on decision-making, particularly among Apple users.
Top 10 Most Important Factors - By Device Type (% Selected)
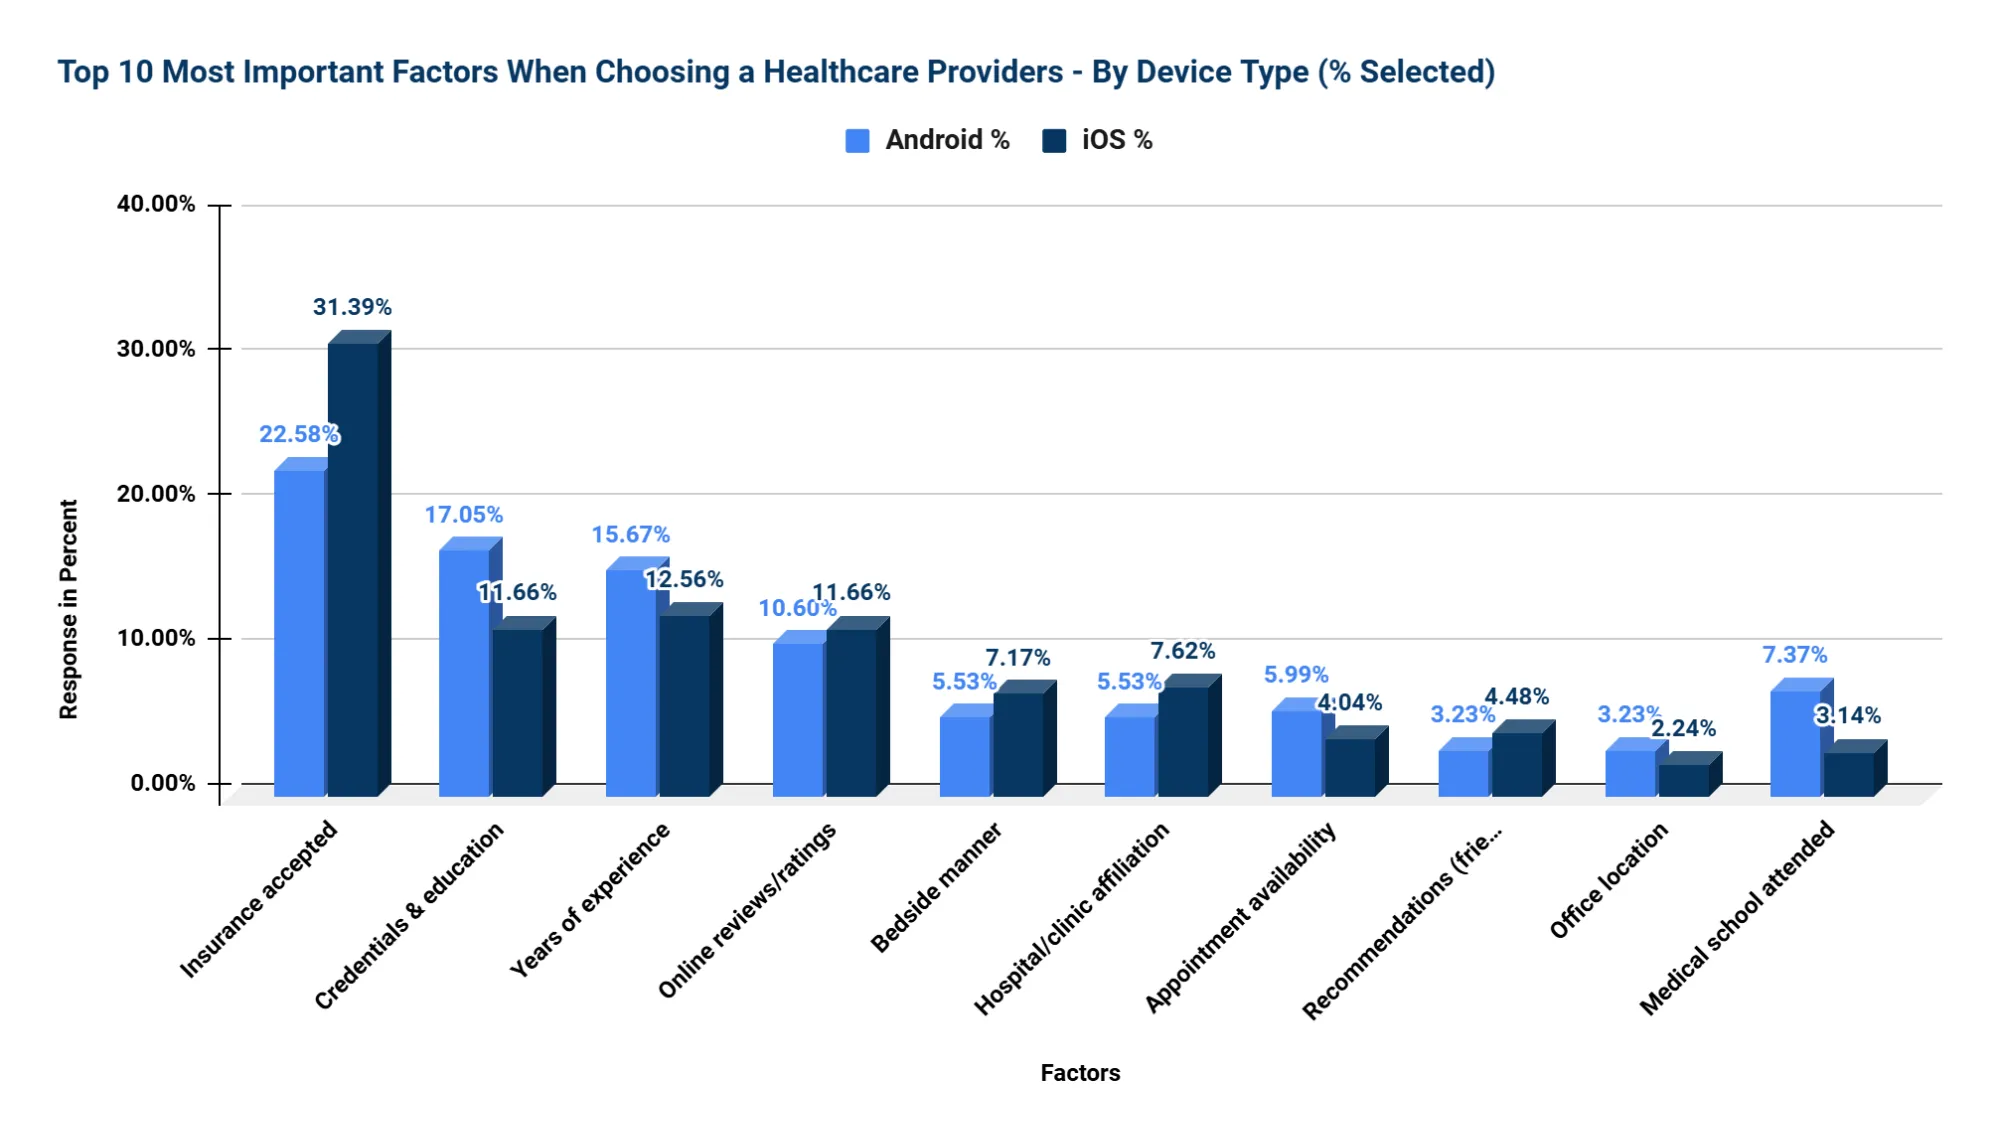
Key Takeaways:
1. Insurance Accepted is the Top Factor for Both — Especially iOS Users
- iOS users: 31.39% selected it as their top factor
- Android users: 22.58%
- Insight: iOS users are 39% more likely than Android users to prioritize insurance acceptance.
2. Android Users Emphasize Credentials and Experience
- Credentials & Education: Android 17.05%, iOS 11.66% → Android users are 46% more likely to prioritize this.
- Years of Experience: Android 15.67%, iOS 12.56% → Android users are 25% more likely to care about experience.
- Insight: Android users show a stronger preference for provider qualifications and background.
3. Online Reviews Matter Equally
- iOS: 11.66% | Android: 10.60%
- a 10% difference, suggesting reviews are consistently important across platforms.
4. iOS Users Care More About Soft Skills and Brand Trust
- Bedside Manner: iOS 7.17%, Android 5.53% → iOS users are 30% more likely to value this.
- Hospital Affiliation: iOS 7.62%, Android 5.53% → iOS users are 38% more likely to prioritize it.
- Insight: iOS users lean toward empathy and institutional reputation.
5. Android Users Value Operational Aspects More
- Appointment Availability: Android 5.99%, iOS 4.04% → Android users are 48% more likely to care.
- Office Cleanliness: Android 2.76%, iOS 0.45% → Android users are over 5× more likely to prioritize cleanliness.
- Insight: Android users show a higher sensitivity to logistics and the environment.
6. Doctor's Gender and Language are Low Priorities for Both
- Language: Android 0.46%, iOS 1.35%
- Gender: Android 0.00%, iOS 1.35%
- Insight: These factors matter to a very small subset of users and are not primary decision drivers.
Behavioral and Decision-Making Differences by Device Type
| Category | Android Users | iOS Users |
|---|---|---|
| Demographics | Tend to be older and more male; show an analytical approach when selecting providers. | Tend to be younger and more female; prioritize speed and ease of access. |
| Research Style | More likely to spend extended time comparing options; place strong trust in online reviews. | Prefer faster decision-making; often rely on personal recommendations and quick booking. |
| Decision Drivers | Prioritize objective criteria like credentials, years of experience, and online ratings. | Value interpersonal factors like friendliness, availability, and accepted insurance. |
| Sensitivity to Reviews | Extremely review-sensitive; online ratings heavily influence provider selection. | Also influenced by reviews, but to a slightly lesser extent than Android users. |
Key Takeaway:
Android users tend to be older and more analytical, prioritizing detailed credentials and spending more time researching, with strong reliance on reviews. In contrast, iOS users are generally younger, convenience-driven, and value friendly service, quick booking, and insurance acceptance. Both groups care about reviews, but Android users are more sensitive to them. Tailoring healthcare provider information and booking experiences to these distinct preferences can improve user satisfaction and engagement.
Interpretation of Results (By Device)
Behavioral Differences
Android users tend to be more research-intensive, likely influenced by their older age and higher income profile. They place strong trust in online reviews, prioritize provider experience and credentials, and show greater attention to language options. In contrast, iOS users, who skew younger and female, demonstrate more balanced preferences. They are somewhat less focused on credentials and reviews, placing higher value on convenience, quick appointment booking, and personal recommendations. PC users, although limited in sample size, appear more traditional in their approach, prioritizing professionalism and bedside manner over digital factors.
Universal Preferences
Across all device types, practical considerations such as insurance coverage, appointment availability, and office cleanliness consistently rank highest. More subjective factors-such as the provider’s gender or language spoken-are generally less influential, though language remains relatively important among Android and Windows users.
Strategic Implications for Healthcare Providers
- Mobile-First Optimization: With over 98% of respondents using mobile devices, healthcare platforms must ensure all provider listings, appointment scheduling features, and review management tools are fully optimized for mobile use.
- Digital Reputation Management: Nearly 80% of users have avoided providers based on negative reviews, underscoring the critical importance of maintaining a strong, positive online presence.
- Tailored Messaging:
- For Android users, emphasize provider qualifications, experience, and trustworthy reviews.
- For iOS users, highlight convenience, fast booking capabilities, and the friendliness of the staff.
- Operational Excellence: Cleanliness, professionalism, and smooth patient interactions significantly impact provider loyalty and retention.
- Retention Focus: With over 64% of users “very likely” to remain loyal after a positive initial experience, investing in patient satisfaction from the outset delivers substantial long-term returns.
Section B: Cross-Demographic Trends & Behavioral Insights
This section highlights both common patterns and key differences in how patients make healthcare decisions across five important demographic groups: Age, Gender, Income, Region, and Device Type. Through the use of side-by-side tables, visual indicators, and detailed interpretations, we provide a clear comparison that makes it easy to understand where preferences align and where they diverge. This approach helps reveal the unique needs and priorities of each group, enabling healthcare providers to tailor their strategies more effectively.
B1. Top Factors When Choosing a Healthcare Provider
Understanding what patients value most is essential for healthcare providers seeking to build trust and improve the patient experience. This section examines the top decision-making factors across key demographic segments-age, gender, income, region, and device type-to uncover both universal drivers and subtle variations in preference.
Universally Most Important Factor
Insurance acceptance emerged as the top-rated factor across all groups, confirming that coverage compatibility is the single most influential consideration when patients choose a provider. Regardless of age, gender, income level, or geographic location, patients prioritize knowing whether a provider is in-network.
Weighted Average Scores Across All Groups (1-5 Scale)
| Factor | Age Avg | Gender Avg | Income Avg | Region Avg | Device Avg |
|---|---|---|---|---|---|
| Insurance Accepted | 4.60 | 4.51 | 4.48 | 4.53 | 4.52 |
| Appointment Availability | 4.23 | 4.23 | 4.23 | 4.31 | 4.36 |
| Cleanliness & Staff | 4.22 | 4.25 | 4.23 | 4.23 | 4.46 |
| Credentials & Education | 3.93 | 4.03 | 4.06 | 4.63 | 4.18 |
| Online Reviews | 4.02 | 4.04 | 4.03 | 4.02 | 4.04 |
| Doctor's Gender | 2.87 | 2.86 | 2.87 | 2.86 | 2.87 |
Insights:
Insurance acceptance is the top priority
- It received the highest scores across all demographics, indicating that coverage and affordability are the most important factors in healthcare decisions.
Appointment availability and cleanliness are highly valued
- Both factors scored above 4.0, showing that patients prioritize timely access to care and a hygienic environment.
- Both factors scored consistently above 4.0, showing that ease of access and a clean, welcoming environment are essential for patients.
Doctor’s credentials vary in importance by region
- The score for credentials ranged significantly, with the highest in the regional average. This suggests that in some areas, qualifications are a stronger consideration than in others.
Online reviews are consistently important
- Scores hovered around 4.0 across all groups, indicating that people regularly consider feedback from others when choosing healthcare providers.
Doctor’s gender is the least important factor
- With the lowest scores (below or around 3.0), this shows that most people do not place much weight on the gender of the doctor.
Device users value cleanliness and convenience more
- Users accessing services via devices gave the highest ratings for cleanliness and appointment availability, suggesting they prioritize ease and presentation when engaging online.
B2. Research Behavior – Time and Tools
Before choosing a healthcare provider, patients often spend time researching their options-but how much time, and what tools do they use? This section explores the behaviors and preferences around healthcare research across different demographic groups, offering a closer look at how time investment and information sources vary.
Time Spent Researching by Demographic Group
The amount of time patients spend researching providers differs significantly based on age, income, gender, device type, and geographic region. Younger patients and iOS users tend to make quicker decisions, while older adults, males, and higher-income groups often invest more time in the process.
| Group | Most Common Research Time | Insight |
|---|---|---|
| Age 18–29 | 30 minutes – 1 hour (40.00%) | Younger patients lean toward quicker decisions, often using digital tools. |
| Age 45–60 | 1 – 2 hours (30.68%) | Middle-aged adults dedicate more time to research, likely seeking quality and assurance. |
| Male | 2 – 3 hours (22.65%) | Males show a tendency for longer research, possibly comparing multiple sources. |
| Female | Less than 1 hour (47.17%) | Nearly half of the female respondents make quicker decisions, possibly using trusted sources like referrals. |
| Income $125k–199k | 2 – 3 hours (28-35%) | Higher-income groups invest more time, potentially due to broader provider options or higher expectations. |
| iOS Users | Less than 1 hour (59.44%) | iOS users appear to prioritize speed and efficiency in decision-making. |
| Android Users | 1 – 2 hours (48.99%) | Android users typically fall in the mid-range for time spent researching. |
| Pacific Region | 1 – 2 hours (37.41%) | Patients in this region tend to take a moderate but thorough research approach. |
| Middle Atlantic | 1 – 2 hours or more (73.24%) | This region reports the longest research times, suggesting a more cautious or thorough evaluation process. |
Top Search Tools by Demographic Group
Patients use a variety of tools to discover healthcare providers. While insurance directories and search engines are broadly popular, preferences shift depending on demographic context. Males and high-income earners gravitate toward review sites, while females and lower-income groups are more likely to rely on insurance directories and personal referrals.
| Demographic Group | Top 2 Discovery Methods | Insight |
|---|---|---|
| All Ages | Insurance Directory, Search Engine | These are baseline tools used across most patient groups. |
| Males | Review Sites, Search Engine | Indicates higher reliance on public digital feedback. |
| Females | Insurance Directory, Referrals | Suggests trust in coverage networks and personal recommendations. |
| High Income | Review Sites, Hospital Websites | Higher expectations likely drive the use of more detailed and reputation-based resources. |
| Low Income | Insurance Directories, Search Engines | Accessibility and affordability guide tool choice. |
| Pacific Region | Reviews, Insurance Directory | Review platforms and network coverage are key trust indicators. |
Summary:
Patients do not approach the decision to choose a healthcare provider uniformly. Younger, digitally native users favor quick research via mobile and online tools, while older and higher-income patients often invest more time in evaluating credentials and online reviews. Gender and income also shape trust in sources—whether that’s a hospital website, a referral, or a search engine result.
By understanding the time patients invest and the sources they turn to, providers can better position themselves, whether that’s optimizing their presence in review platforms, updating profiles in insurance directories, or improving SEO visibility for hospital websites.
B3. Influence of Online Reviews
Online reviews have become a powerful factor in healthcare decision-making. Patients often rely on peer feedback as a way to assess provider quality, bedside manner, and overall trustworthiness, especially when other details (like credentials or affiliations) seem similar. This section explores how strongly online reviews influence patients’ choices, particularly their willingness to avoid providers with negative feedback.
Percentage of Patients Who Avoided a Provider Due to Negative Reviews
A majority of patients across all demographics indicated that they have avoided a healthcare provider because of bad reviews, but the strength of this behavior varies by age, income, gender, and device preference.
| Demographic Group | % Who Avoided a Provider | Insight |
|---|---|---|
| Age 18–29 | 82.70% | Younger patients are highly sensitive to a provider's online reputation. |
| Age 30–44 | 78.50% | Reviews strongly influence early middle-aged adults. |
| Age 60+ | 55.60% | Older adults are less influenced by reviews, but they still consider them. |
| Male | 80.10% | A high proportion of men avoid providers with poor online feedback. |
| Female | 78.10% | A significant number of women factor in negative reviews when choosing care. |
| Income $125k–149k | 95.10% | High-income earners are especially conscious of online reviews. |
| Income $150k–174k | 100% | All respondents in this income group avoided poorly reviewed providers. |
| Middle Atlantic | 87.32% | Most influenced by online reputation, with 87.32% avoiding providers due to bad reviews. |
| Pacific | 83.67% | In the Pacific region, 83.67% of respondents reported avoiding providers based on negative online reviews, highlighting the strong impact of online feedback. |
| Android Users | 82.50% | Android users are highly influenced by online sentiment. |
| iOS Users | 75.30% | iOS users also show strong sensitivity to provider reviews. |
Summary:
Online reviews are a key factor in provider selection across all demographics. Younger adults (82.7%), high-income earners (up to 100%), and Android users (82.5%) are the most likely to avoid poorly reviewed providers. Even older adults (55.6%) and iOS users (75.3%) show notable sensitivity. Regions like the Middle Atlantic (87.3%) and Pacific (83.7%) also demonstrate strong influence. For providers, maintaining a positive online reputation is essential.
B4. Provider Loyalty – Who Stays and Who Switches?
Loyalty to a healthcare provider plays a critical role in long-term patient satisfaction, continuity of care, and retention strategies. However, not all patients are equally committed to sticking with their current provider. This section explores which demographic groups are most likely to stay with a preferred provider and which are more inclined to switch.
Percentage of Patients “Very Likely” to Stay with Their Preferred Provider
The likelihood of remaining loyal to a healthcare provider varies widely across age groups, income levels, gender, region, and even mobile platforms. The following table shows the percentage of respondents in each group who indicated they are very likely to stay with their current provider.
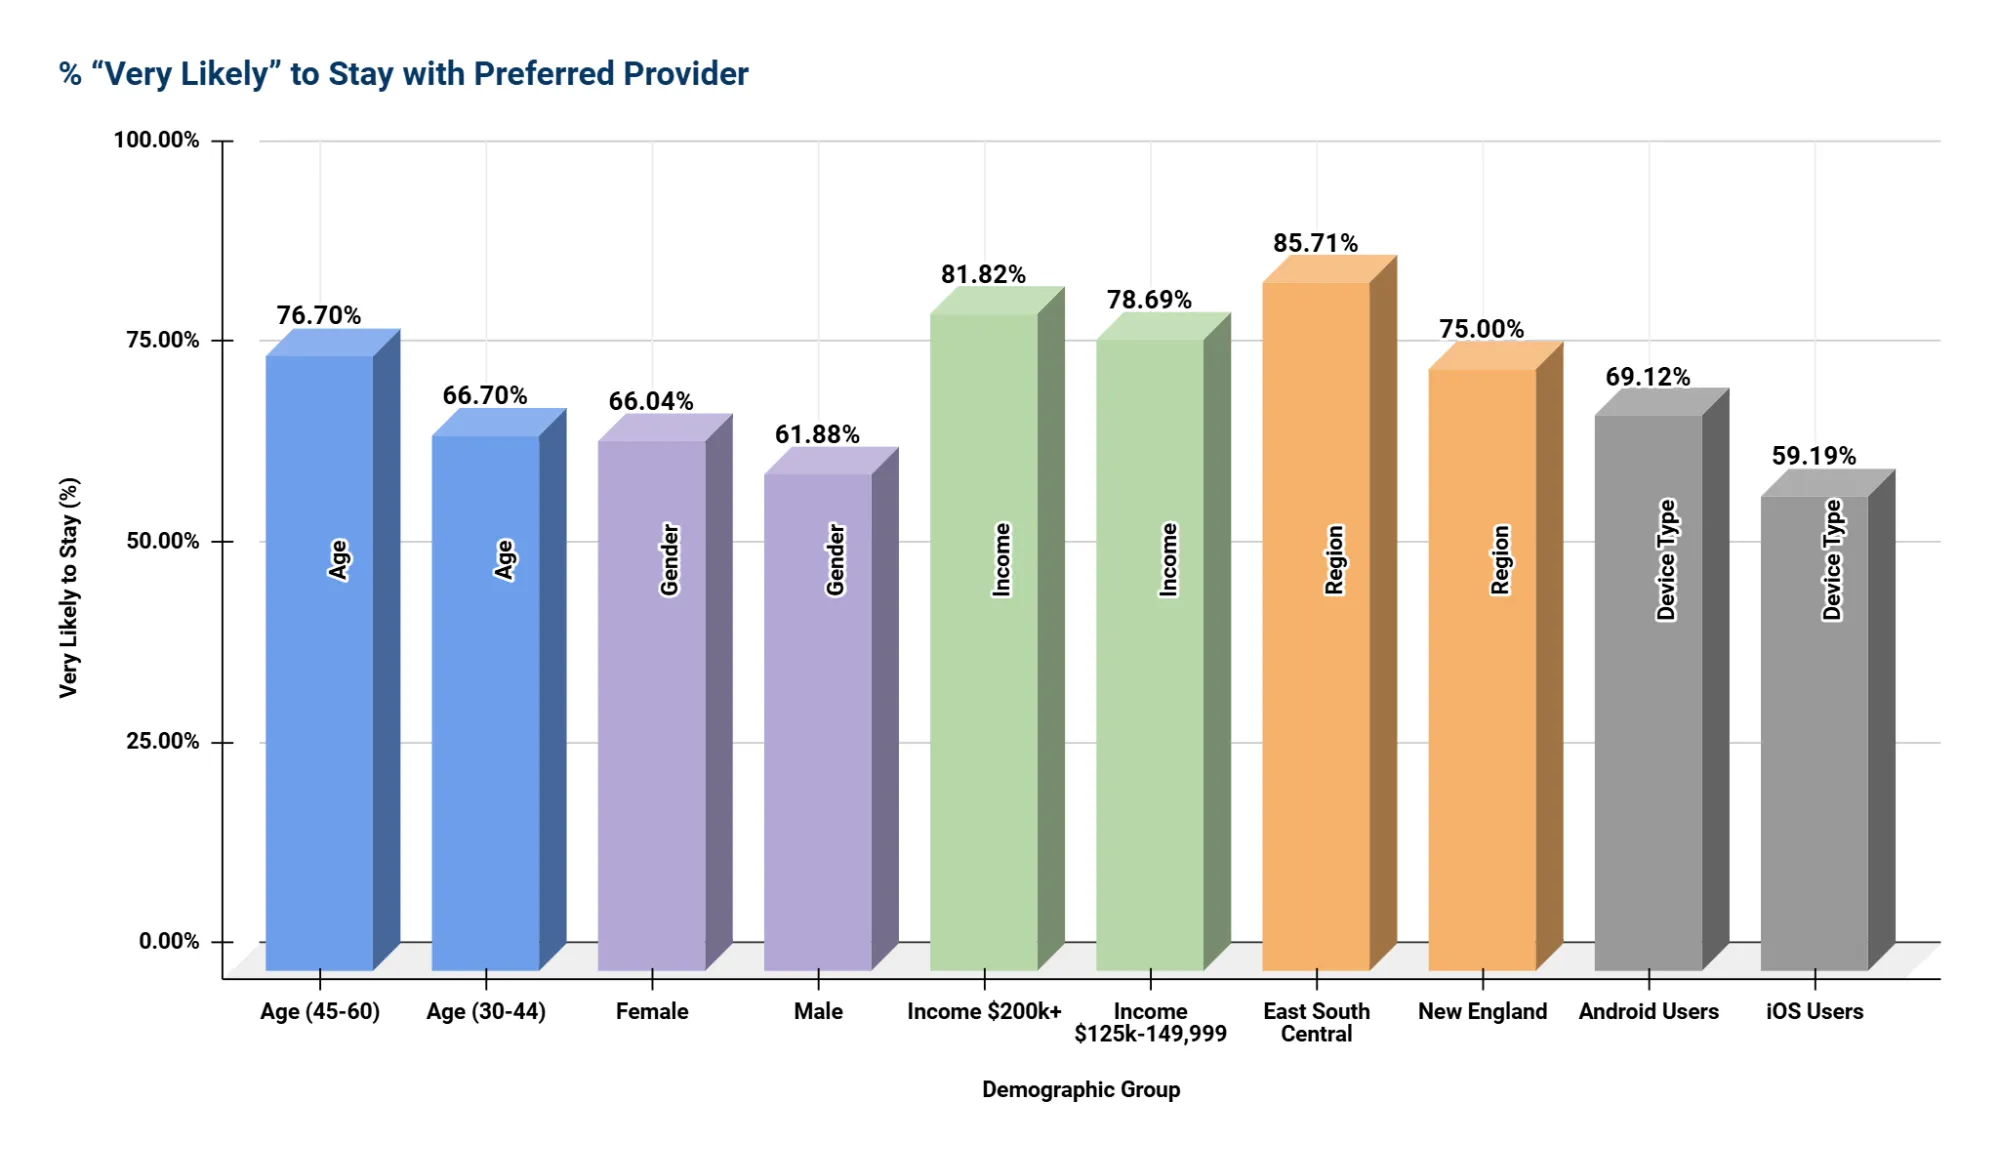
East South Central*
New England*
* Small sample size — interpret with caution
Summary:
The table presents the top two demographic groups in each category based on the highest percentages of respondents who are "Very Likely to Stay" with their provider. Loyalty is strongest among high-income individuals, 81.82% of those earning $200k+ and 78.69% of those earning $125k–149,999. Regionally, East South Centra* (85.71%) and New England* (75%) lead in provider loyalty. Among age groups, adults aged 45-60 (76.70%) and 30-44 (66.70%) show the highest retention. Female respondents (66.04%) reported slightly higher loyalty than males (61.88%). Lastly, Android users (69.12%) were more likely to stay than iOS users (59.19%).
B5. Dissatisfaction and Switching Triggers
While many patients remain loyal to their providers, dissatisfaction is a major driver of switching behavior. This section identifies the most common reasons patients across all demographics consider changing healthcare providers. Notably, these triggers are not rooted in technical qualifications or clinical expertise, but in the quality of interpersonal experience.
Top 5 Dissatisfaction Drivers (Consistent Across Demographics)
| Rank | Common Cause of Dissatisfaction | Insight |
|---|---|---|
| 1 | Doctor didn't listen or rushed the appointment | Patients across all groups value being heard. Feeling dismissed is the top reason for dissatisfaction. |
| 2 | Didn't explain conditions clearly | Clear, understandable communication is essential to trust and decision-making. |
| 3 | Poor communication or bedside manner | A provider's tone, demeanor, and clarity significantly impact patient perception. |
| 4 | Lack of empathy or respect | Emotional intelligence and respect are fundamental expectations, regardless of demographics. |
| 5 | Long wait times or billing issues (especially for high-income) | Operational inefficiencies can erode trust, particularly among patients who expect premium service. |
Summary
Patient dissatisfaction across age, gender, income, region, and device usage tends to stem more from soft skills than from technical qualifications. When patients feel overlooked, hurried, or disrespected, they are much more likely to change providers even if their provider is clinically proficient. This highlights the vital role of empathy, communication, and patient-focused care in building lasting loyalty and trust.
Section C: Recommendations for Healthcare Providers
Drawing from detailed insights across five core demographic dimensions-age, gender, income, region, and device type-this section translates patient preferences into actionable strategies for healthcare providers. These recommendations are designed to help organizations align with patient expectations, enhance satisfaction, and build long-term loyalty in an increasingly competitive and consumer-driven healthcare landscape.
1. Insurance Acceptance Is Non-Negotiable
Insight: Insurance acceptance ranked as the most important factor across every demographic group, regardless of age, gender, income level, region, or device used. It is the primary gateway to patient access and trust.
Recommended Actions:
- Display accepted insurance plans across all patient-facing platforms, including your website, third-party directories, and provider profiles.
- Regularly review and prioritize participation in the most widely used insurance plans in your region.
2. Online Reputation Drives Patient Decisions
Insight: About 79% of respondents reported avoiding a provider due to negative online reviews. This behavior is especially pronounced among patients aged 18-44, males, high-income individuals, and both Android and iOS users.
Recommended Actions:
- Implement a proactive online review management strategy, including timely responses to feedback.
- Encourage satisfied patients to leave public reviews following positive experiences.
- Monitor key third-party platforms-such as Google, Yelp, Healthgrades, Vitals, WebMD, RateMDs and ZocDoc-on a weekly basis.
3. Tailor Messaging by Demographic Group
Insight: Preferences and expectations vary widely across age groups, gender, income levels, and device types. Personalized communication and marketing are essential to connecting with patients in a way that resonates.
Recommended Strategies by Segment:
| Group | Tailored Messaging Focus |
|---|---|
| Younger Adults (18-29) | Emphasize digital convenience, online reviews, and fast booking options |
| Middle-Aged (45-60) | Highlight provider credentials, appointment availability, and experience |
| Seniors (60+) | Focus on trust, insurance acceptance, and clear, respectful communication |
| Males | Promote credentials, clinical expertise, and outcomes |
| Females | Emphasize empathy, clear explanations, and staff friendliness |
| High-Income Patients | Highlight provider affiliations, advanced education, convenience, and elite care |
| Low-Income Patients | Stress affordability, insurance compatibility, and ease of access |
| iOS Users | Market mobile convenience and polished in-office professionalism |
| Android Users | Emphasize reputation, accessibility, and multilingual or culturally aware service offerings |
Recommended Actions:
- Develop segmented marketing content aligned with demographic preferences.
- Use demographic and geographic targeting in digital ads, SEO, and provider profile messaging.
4. Prioritize Frontline Experience and Operational Excellence
Insight: Top reasons for dissatisfaction-and triggers for switching providers-are overwhelmingly tied to "soft" experience factors, including poor communication, rushed appointments, and unprofessional staff behavior.
Recommended Actions:
- Provide regular training for front-desk staff and medical assistants focused on empathy, active listening, and communication.
- Streamline check-in, scheduling, and follow-up processes to reduce wait times and friction.
- Monitor patient satisfaction post-visit through brief surveys to identify and address pain points quickly.
5. Deliver a Mobile-First Digital Experience
Insight: Since 98% of respondents completed the survey on mobile devices, this highlights the growing prevalence of mobile usage. While we can’t directly conclude how they prefer to research healthcare services, it underscores the importance of optimizing websites and marketing materials for a seamless mobile experience.
Recommended Actions:
- Ensure your website is mobile-optimized for speed, clarity, and accessibility.
- Enable mobile-friendly appointment booking, real-time support, and digital intake processes.
- Claim and manage listings on key mobile-accessed platforms like Google, insurer directories, and healthcare review sites.
6. Support Research-Driven Patients with Deeper Content
Insight: Patients who are older, patients with higher income, and Android users all tend to spend significantly more time researching providers, often 2 to 3 hours or more, before making a decision.
Recommended Actions:
- Include detailed provider bios, credentials, treatment approaches, and patient FAQs on your website and directories.
- Feature verified reviews, affiliations, and outcome data in provider profiles.
- Use schema markup to ensure key information appears in search engine results, improving visibility and credibility.
Conclusion: Connecting the Data to Strategy
This analysis reveals that while foundational expectations-such as accepted insurance plans, operational efficiency, and professional conduct-are shared across all patient groups, the underlying drivers of satisfaction, loyalty, and decision-making vary sharply across demographic lines.
Younger patients, particularly iOS users and women, seek speed, simplicity, and responsiveness, making digital convenience and empathetic communication paramount. In contrast, older, higher-income, or Android-using patients value deeper information, credentials, and a strong reputation, requiring transparency, expertise, and thorough online profiles. These intersecting expectations demand a flexible, tiered approach to care delivery and marketing.
Regional nuances add another layer of complexity: patients in the Mountain region prioritize affordability and insurance coverage, while those in the Middle Atlantic emphasize experience and credentials. These insights suggest that healthcare providers must not only adapt by demographics but also by location, acknowledging how cultural, economic, and infrastructural differences shape behavior.
Ultimately, the most successful providers will tailor their approach by aligning operational excellence with personalized outreach. This means:
- Making insurance information universally accessible.
- Managing digital presence and feedback across all channels.
- Investing in communication training and empathetic care.
- Segmenting messages by combined demographic traits, not just age or gender in isolation.
- Ensuring mobile-first platforms deliver both speed and depth.
Today’s patient-first healthcare economy makes understanding these interwoven demographic preferences not just a good strategy-but essential for sustained trust, engagement, and growth.