
Executive Summary
- Social proof as a risk mitigator: This research suggests that healthcare decisions are inherently risky where ~89% of patients seek validation through online reviews for reducing uncertainty in the absence of personal referrals. This highlights the importance for providers to actively manage their presence across key platforms for influencing patient perception.
- Capitalizing on recent experiences: Data highlights that 80% of patients have visited a provider within the last quarter, indicating a consistent flow of recent experiences. This creates a strong opportunity in prioritizing real time review capture through automated triggers within 24-72 hours post visit, to reflect current patient sentiment.
- Credibility through consistency and recency: Survey results suggest that close to 66% of patients consider both average rating and the recency of reviews while evaluating providers indicating that trust is built on both perceived quality and its consistency over time. This is critical because recent reviews reflect current performance, while consistent ratings over time reduces uncertainty, ultimately making patients more likely to choose the provider.
- Income based variation in healthcare management: The analysis highlights income-based variation in engagement, with mid-income cohorts ($50K–$74K, $125K–$149K) driving higher participation, while extreme income segments (<$10K, >$200K) acting as directional outliers.
- Review volumes beat a perfect rating score: The analysis indicates that 56.8% of patients picked a 4.5 star provider with 1,050 reviews over a 4.9 star provider with only 25 reviews while choosing a healthcare network. This shows that having a large number of reviews is the most important way to build trust with new patients.
Objective
This study investigates how online patient reviews influence trust and decision making while selecting healthcare providers. It aims to identify variation in perceptions across demographics such as age, gender, income, region, and device usage to derive actionable insights for optimizing review collection strategies to improve healthcare providers’ digital reputation and improving their patient acquisition approach. It also analyzes the intersection of review volume, star rating realism, and recency, while quantifying how online ‘social proof’ mitigates perceived risk for prospective patients.
Methodology Snapshot
- Approach: Quantitative, cross-sectional survey.
- Data Source: It was a blind anonymous survey conducted via SurveyMonkey hence higher data reliability.
- Target audience: Individuals in the United States referring to online reviews for healthcare decisions.
- Analysis Techniques: Descriptive Statistics and Cross-Tabulation for segment wise insights.
- The survey sample contained respondents from the United States including all the household income groups and both the genders. The age distribution was structured to ensure representation, with 80% respondents between 18-64 years and the remaining 20% between 65-99 years.
- The first and second questions are to filter out eligible responses for maintaining relevance.
- The data was collected in a short window frame of 2-3 business days ensuring that only highly engaged users were participating.
Key Behavioral Insights
1. Around 80% of Patients engage Quarterly, creating a strong opportunity for timely Review Generation.
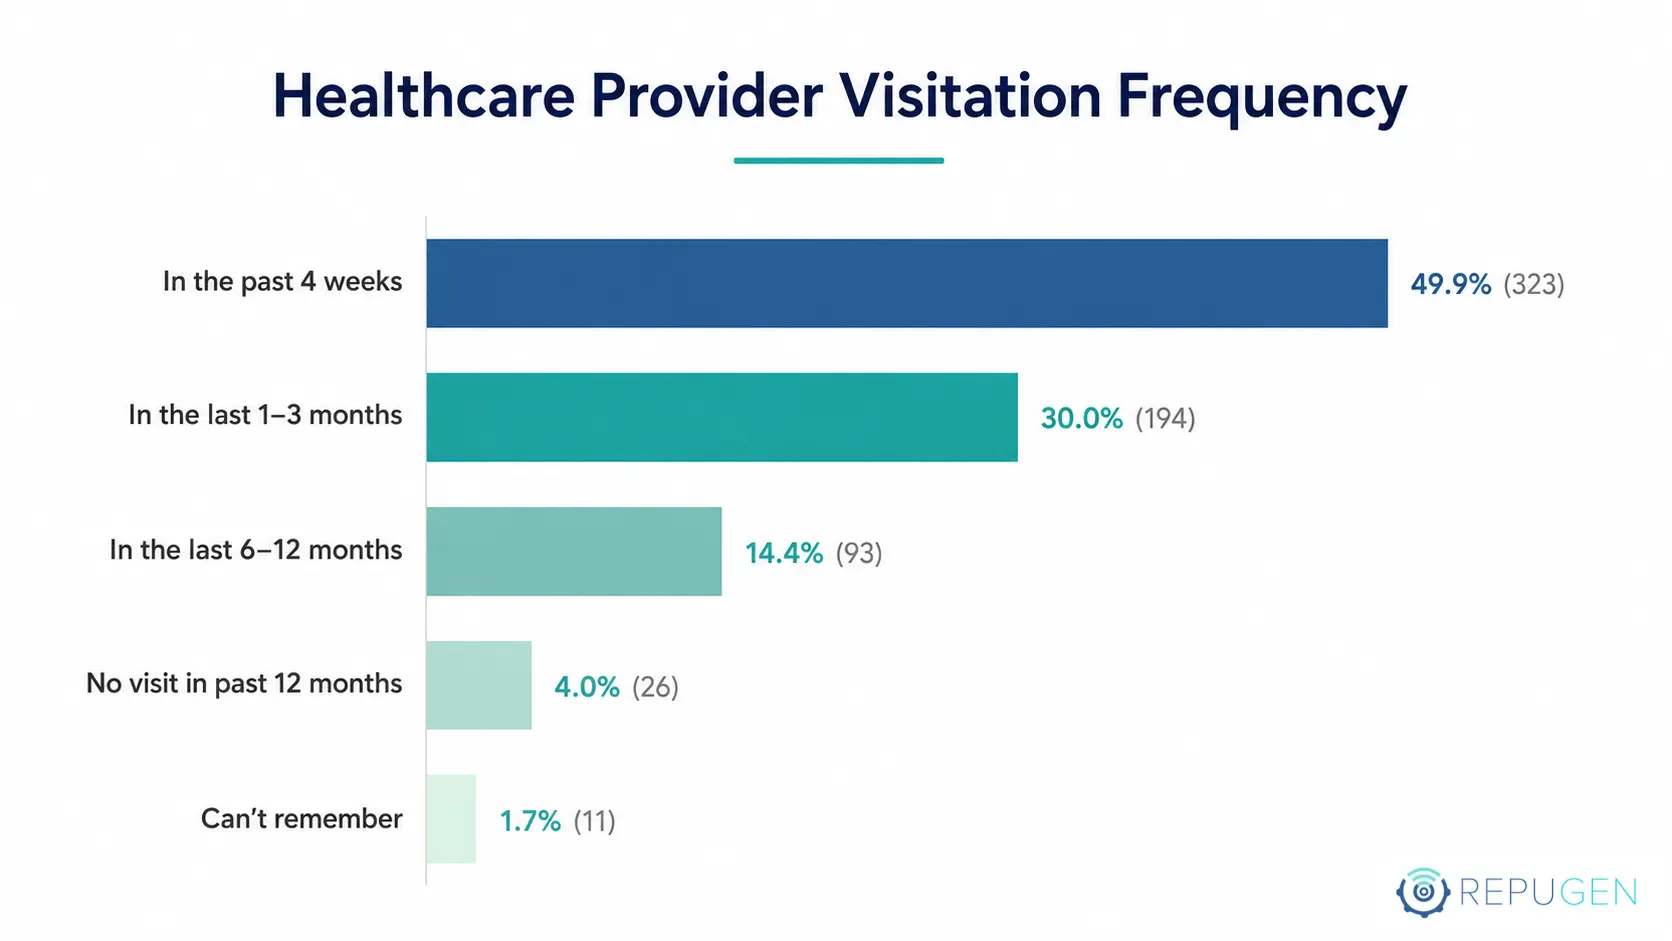
Observation:
- ~ 50% of respondents visited a healthcare provider in the past 4 weeks.
- Combined, approximately 80% of respondents have had a healthcare visit within the last quarter (3 months).
Why it happens:
- Although healthcare interactions are episodic, they are frequent enough to create a steady stream of fresh experiences.
- Patients are more likely to share feedback when the experience is still recent.
RepuGen Implication:
Prioritize real time review capture within 24 to 72 hours post visit.
Automating post feedback review triggers while focusing on the experience closure moments like discharge and consultation for prompt review generation.
2. Online Reviews are Broadly Used for Decision Consideration
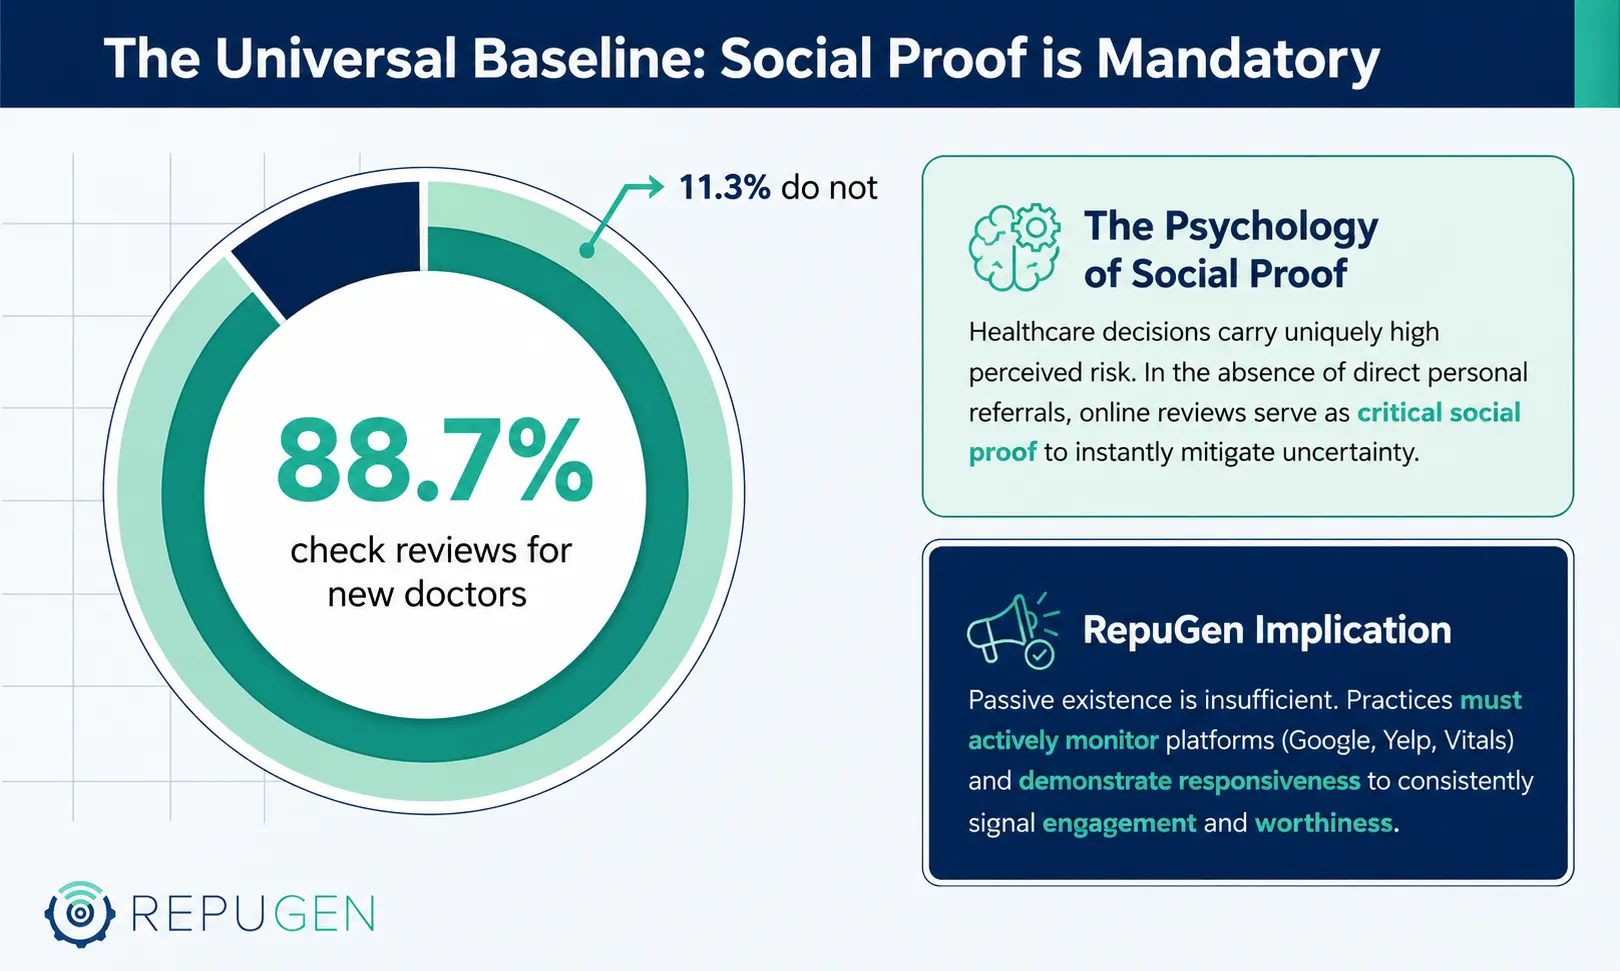
Observation:
~89% of the patients check online reviews when researching a new healthcare provider hence online reputation management is a key driver for shaping public perception.
Why it happens:
- Healthcare decisions are perceived risky and usually involve high trust which leads patients to seek validation.
- Reviews act as a social proof reducing uncertainty in absence of personal referrals.
RepuGen Implication:
Active monitoring and management of reviews across platforms like Google, Yelp, Vitals, Ratemds, Webmd, Healthgrades.
As the majority of patients consult reviews, hence maintaining an active and visible presence becomes imperative for influencing perception.
Implementation of review generation strategies at scale for maintaining the freshness and relevance.
3. Consistence and Freshness are the Key Trust Drivers
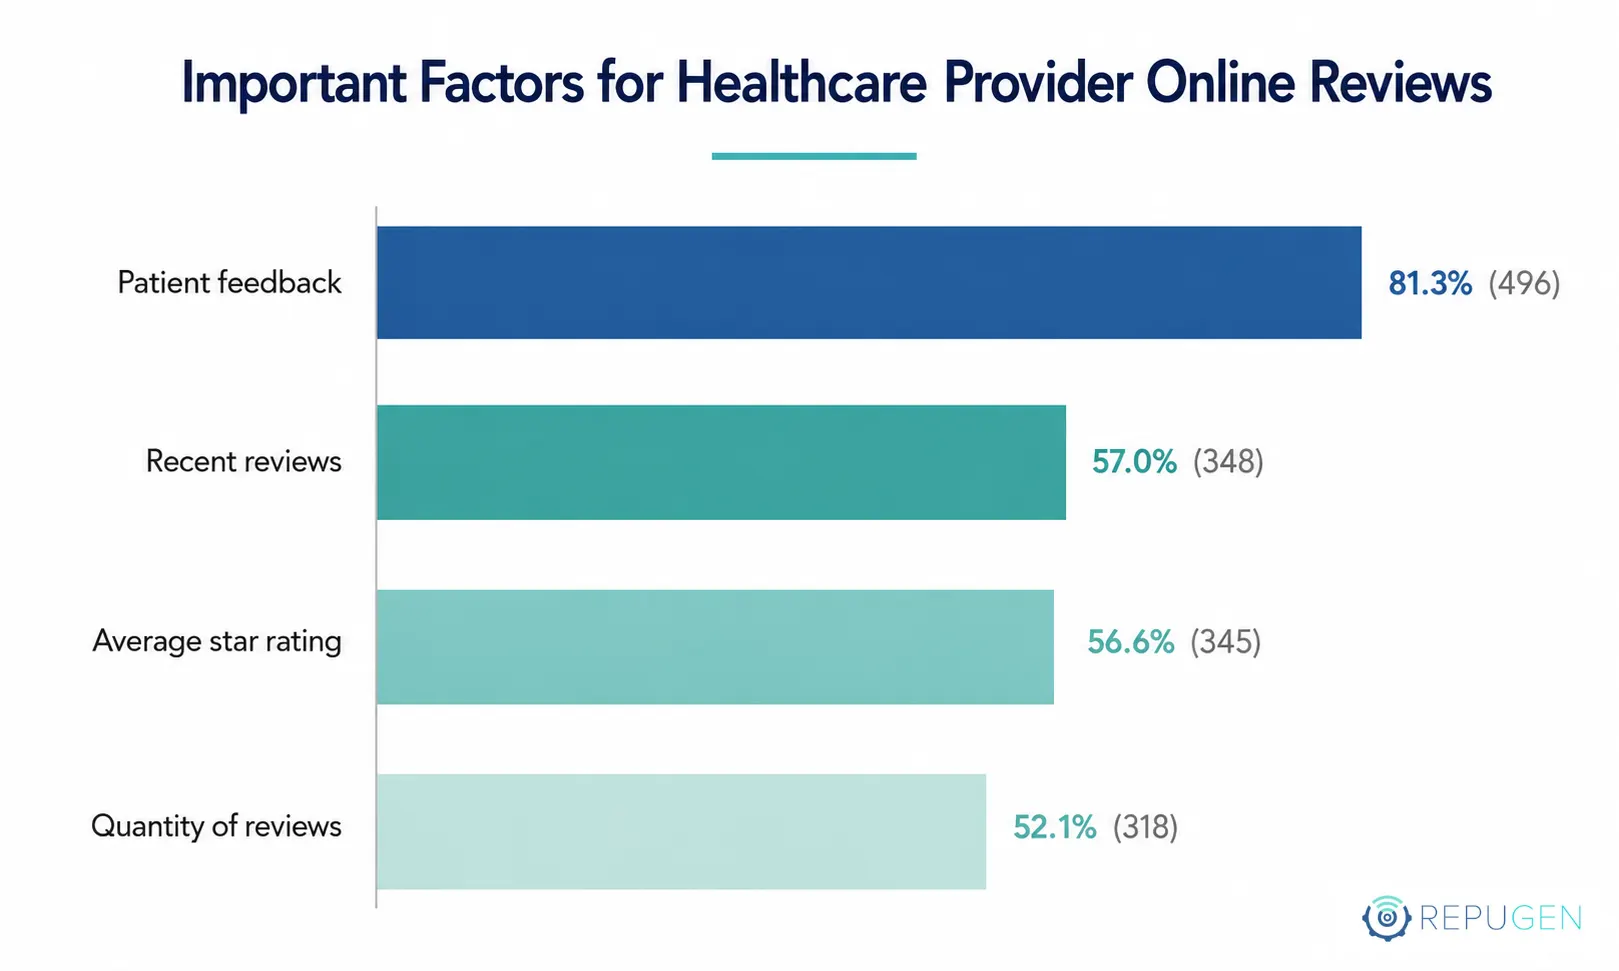
Note: Percentages exceed 100% (multiple-select question). Total Respondents: 541 | Skipped: 106
Observation:
~66% of respondents consider average online rating as well as recency of the reviews while choosing a provider emphasizing the need of constantly maintaining both rating and review repository as well.
Why it happens:
About two thirds of the respondents are glancing not only at the ratings but subconsciously validating the present public perception of providers as well. In absence of fresh reviews patients may perceive a gap in current patient experience leading to uncertainty about the provider’s quality.
Engagement Plan:
Constantly capture and generate fresh reviews to keep the reputation trustworthy.
Engage patients by personalizing follow ups such as through QR based surveys and on-the-spot feedback.
4. Preference for Realistic Ratings and Gender differences in Rating Sensitivity
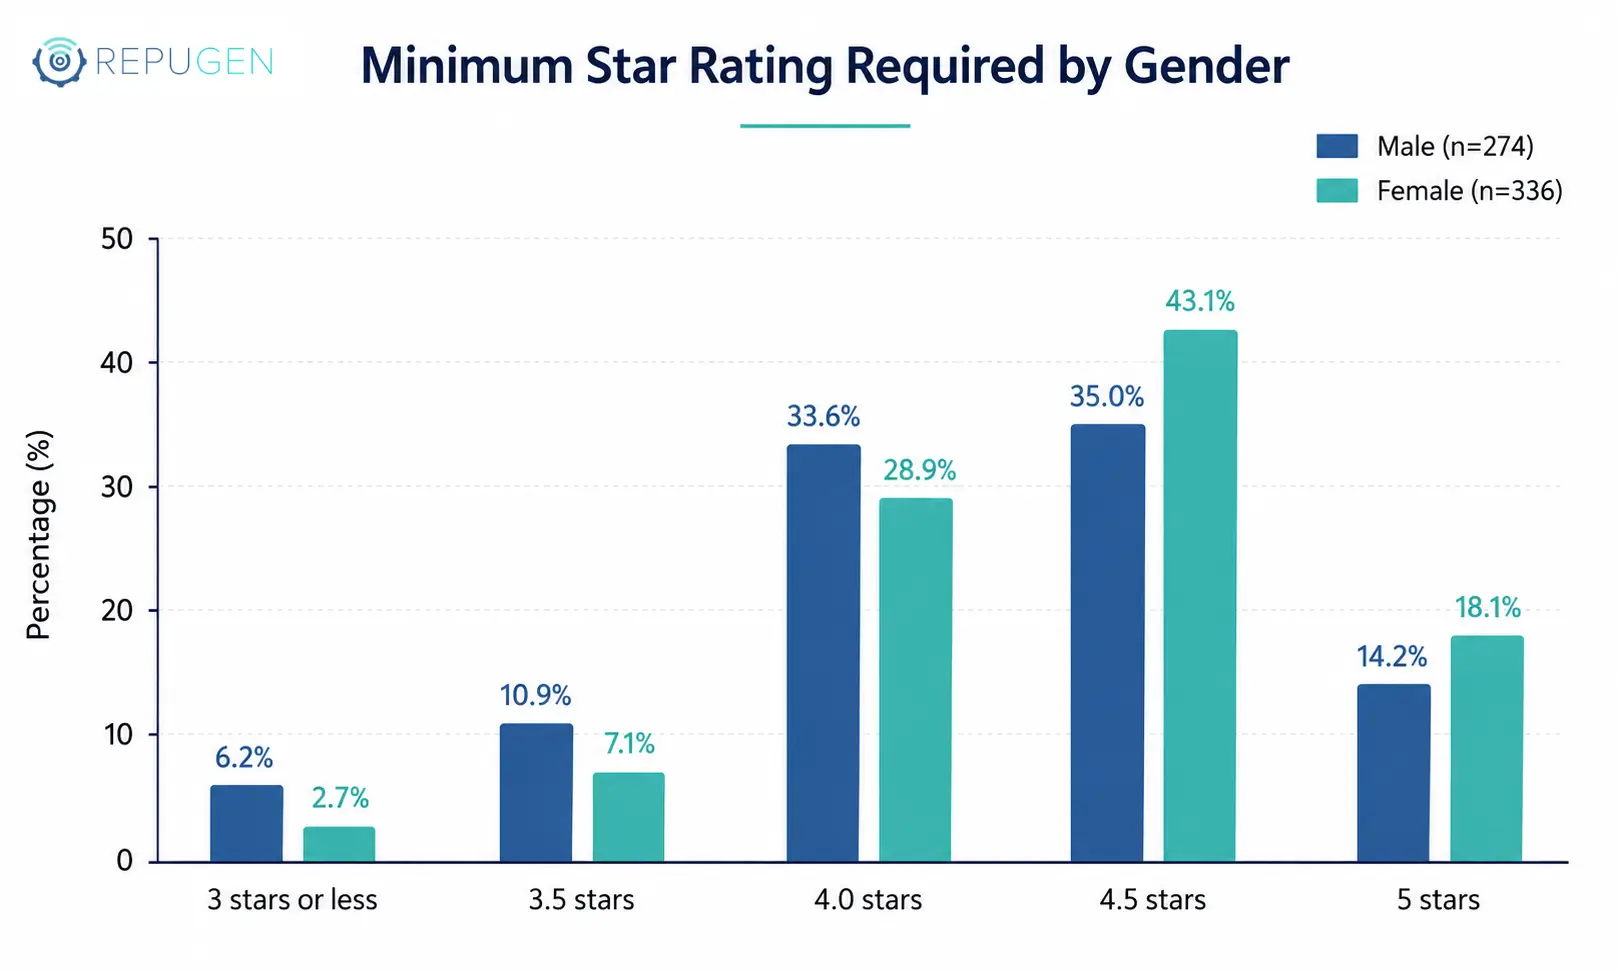
Observation:
Most of the respondents in this survey prefer providers having ratings in the 4.0-4.5 range, with both the gender cohorts showing the highest concentration in this band. ~34% of males and ~29% of females at 4.0 rating, and ~35% of males and ~43% of females at 4.5 rating. This indicates that patients gravitate towards strong yet realistic ratings rather than perfect scores.
Why it happens:
- Risk minimization behavior is implied where a rating above 4.0 signals quality, while slight imperfections suggest genuine experiences reducing skepticism.
- Male audiences generally lean into numbers or the average star rating while females lean into narratives.
Engagement Plan:
An A/B test can be done based on the gender to showcase rating range, total review count for male audiences and surface detailed reviews or qualitative aspects such as the sentiment behind the reviews for the female users.
Based on this experimentation the above hypothesis can be validated upon so as to decide on the final view of the provider score dashboard like RepuTally.
5. Preference for Volume Driven Credibility over isolated High Ratings
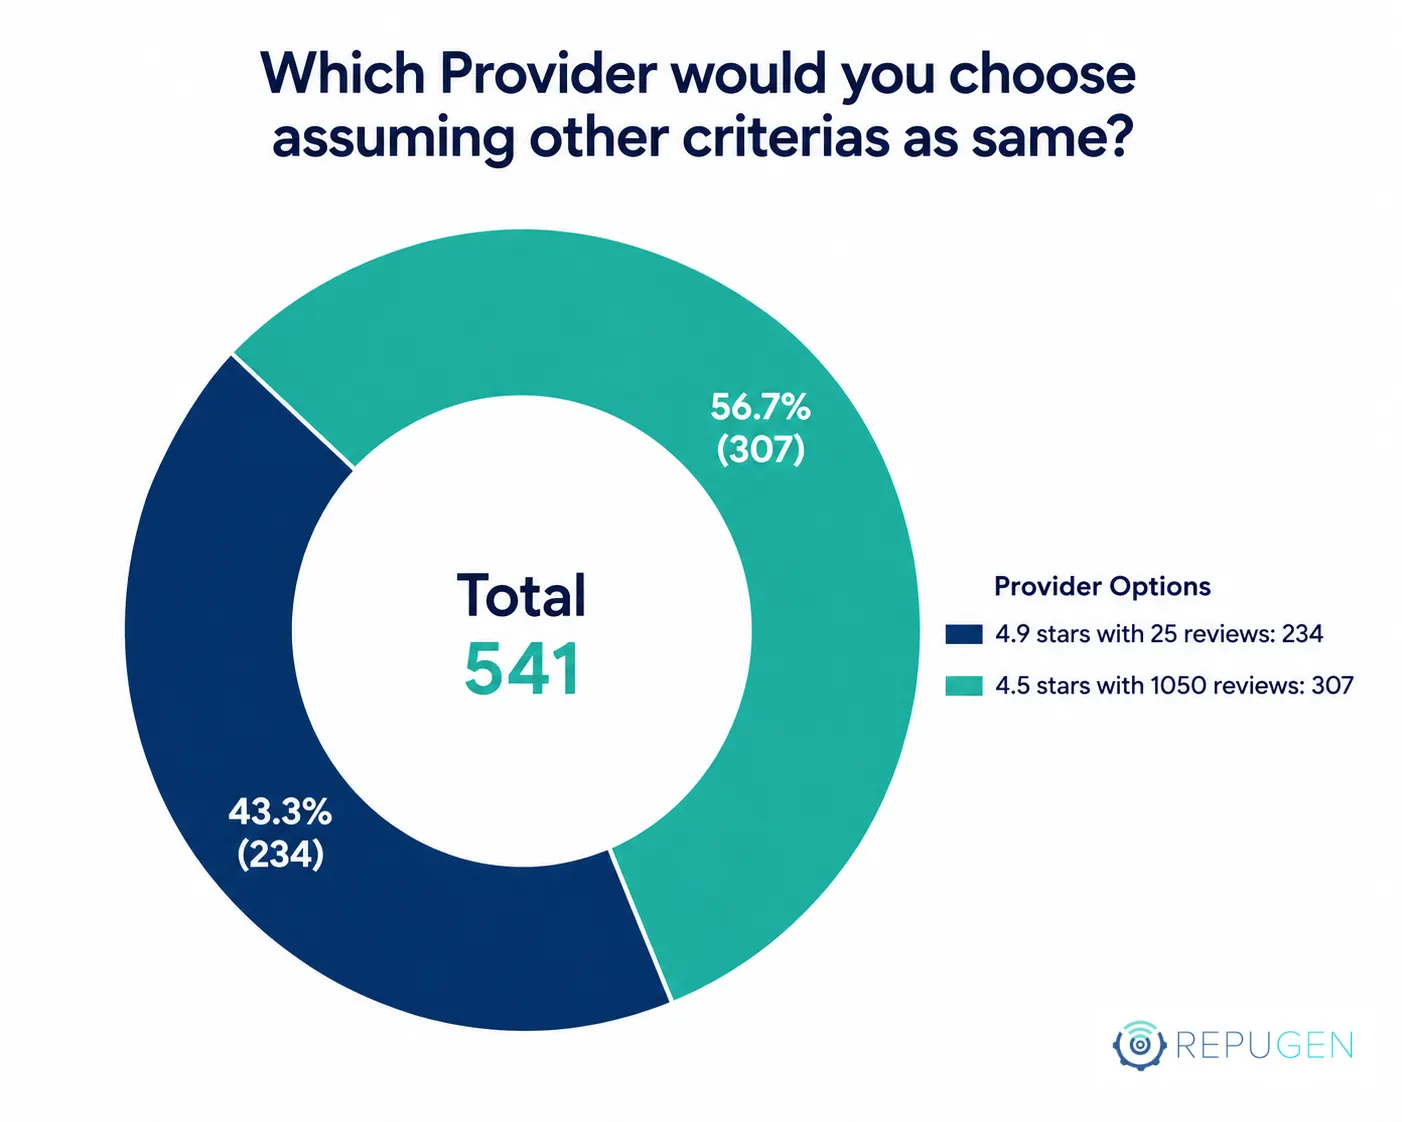
Observation:
Close to 57% of the respondents prefer providers with a high volume of reviews with a lower rating in comparison to providers with a lesser number of reviews with a higher rating, provided that the rating remains above an acceptable threshold which is typically 4.0 and above, indicating that patients value the credibility of a larger number of experiences over isolated high ratings.
Why it happens:
- Credibility over perfection: Slightly lower ratings with many reviews appear more authentic otherwise it may raise doubts about bias or manipulation.
- Information depth: More reviews provide rich insights into different aspects of care namely doctor behavior, wait time, staffing, facilities while enabling better informed decisions.
Engagement Plan:
It is to ensure that the reviews are spread over time and not clustered, amplifying real patient voices across discovery channels like Google, Yelp, Vitals.
Also, there is a need to build a continuous review capture system through post visit nudges and follow ups.
6. Over 70% of Patients rely on Online Reviews, with highest dependence among ages 45-60 (~86%) and lowest among 60+ (~68%)
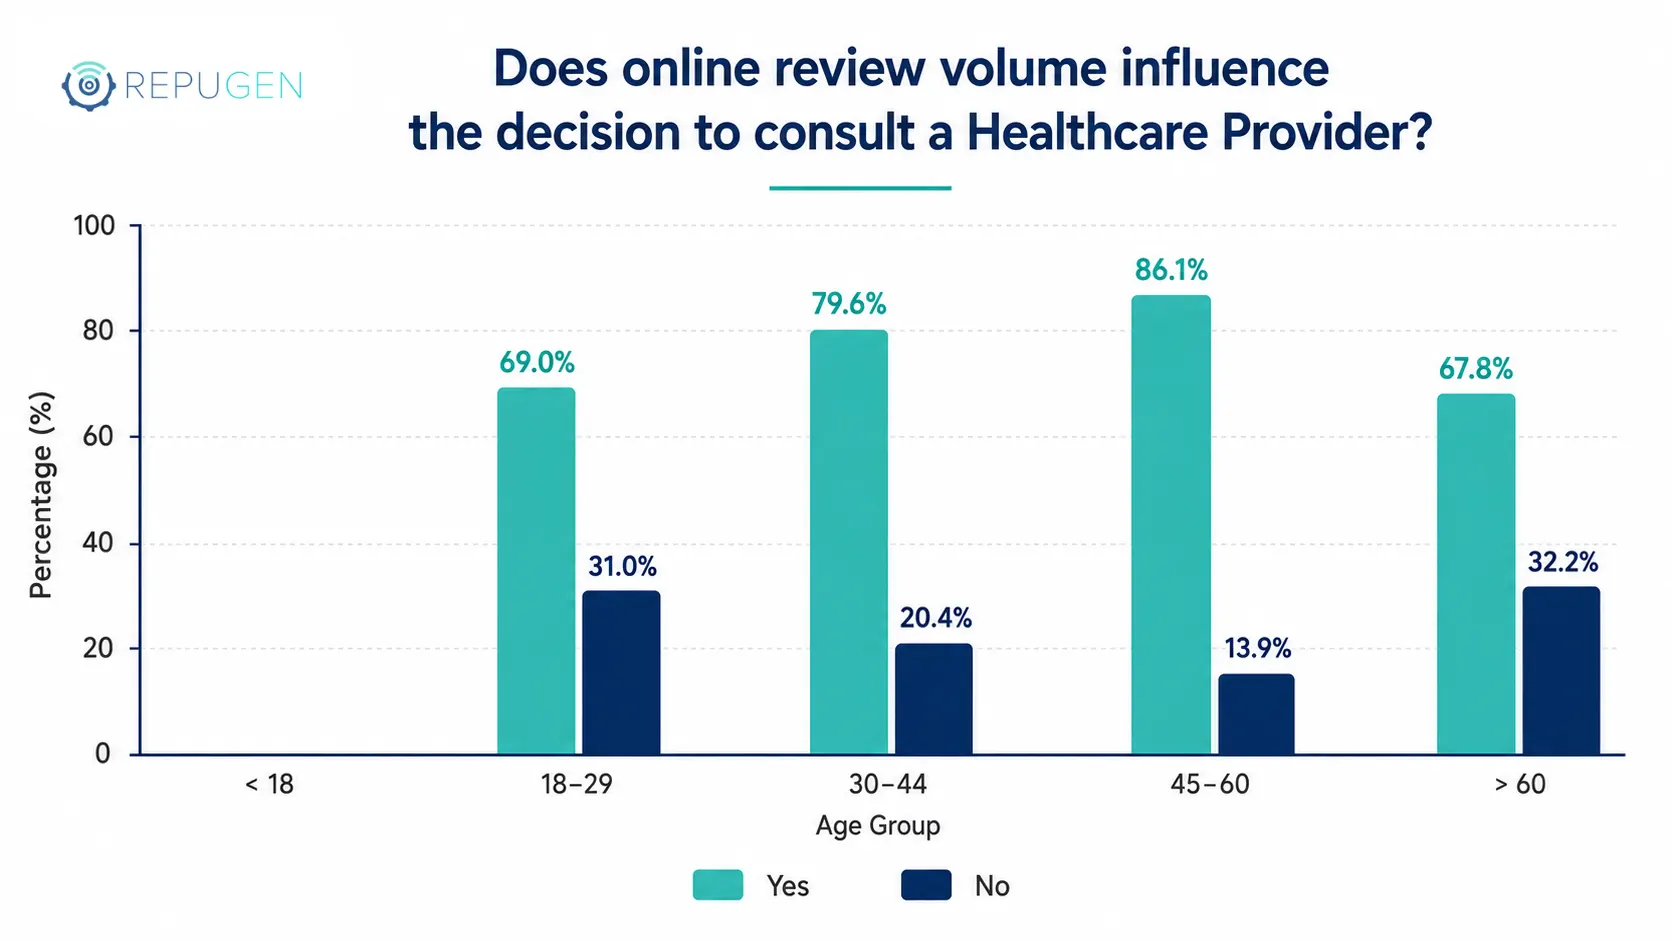
Observation:
A significant majority of patients across age groups rely on online reviews when choosing healthcare providers with reliance exceeding 69% across all cohorts. This dependence peaks among patients aged 45-60 (~86%) followed by those aged 30-44 (~80%), while it is relatively lower among patients aged 60+ (~68%).
Why it happens:
- For mature adults: They often manage chronic health concerns where they tend to be more cautious and in need of constant reassurance to reduce uncertainty before choosing a provider.
- For early midlife adults: In contrast, patients in this segment may rely on a mix of sources like peer recommendations, prior experiences along with traditional online research, therefore the online reviews may not carry the same relevance as they are tech savvy to filter information and make informed decisions quickly.
Engagement Plan:
To target the mature adults’ cohort, reputation platforms should highlight patient testimonials, rating and success stories prominently while emphasizing credibility markers such as review volumes and response rate.
To appeal to early midlife adults who value speed and clarity, it becomes imperative to weave reputation metrics with rapid decision-making touchpoints such as search and booking.
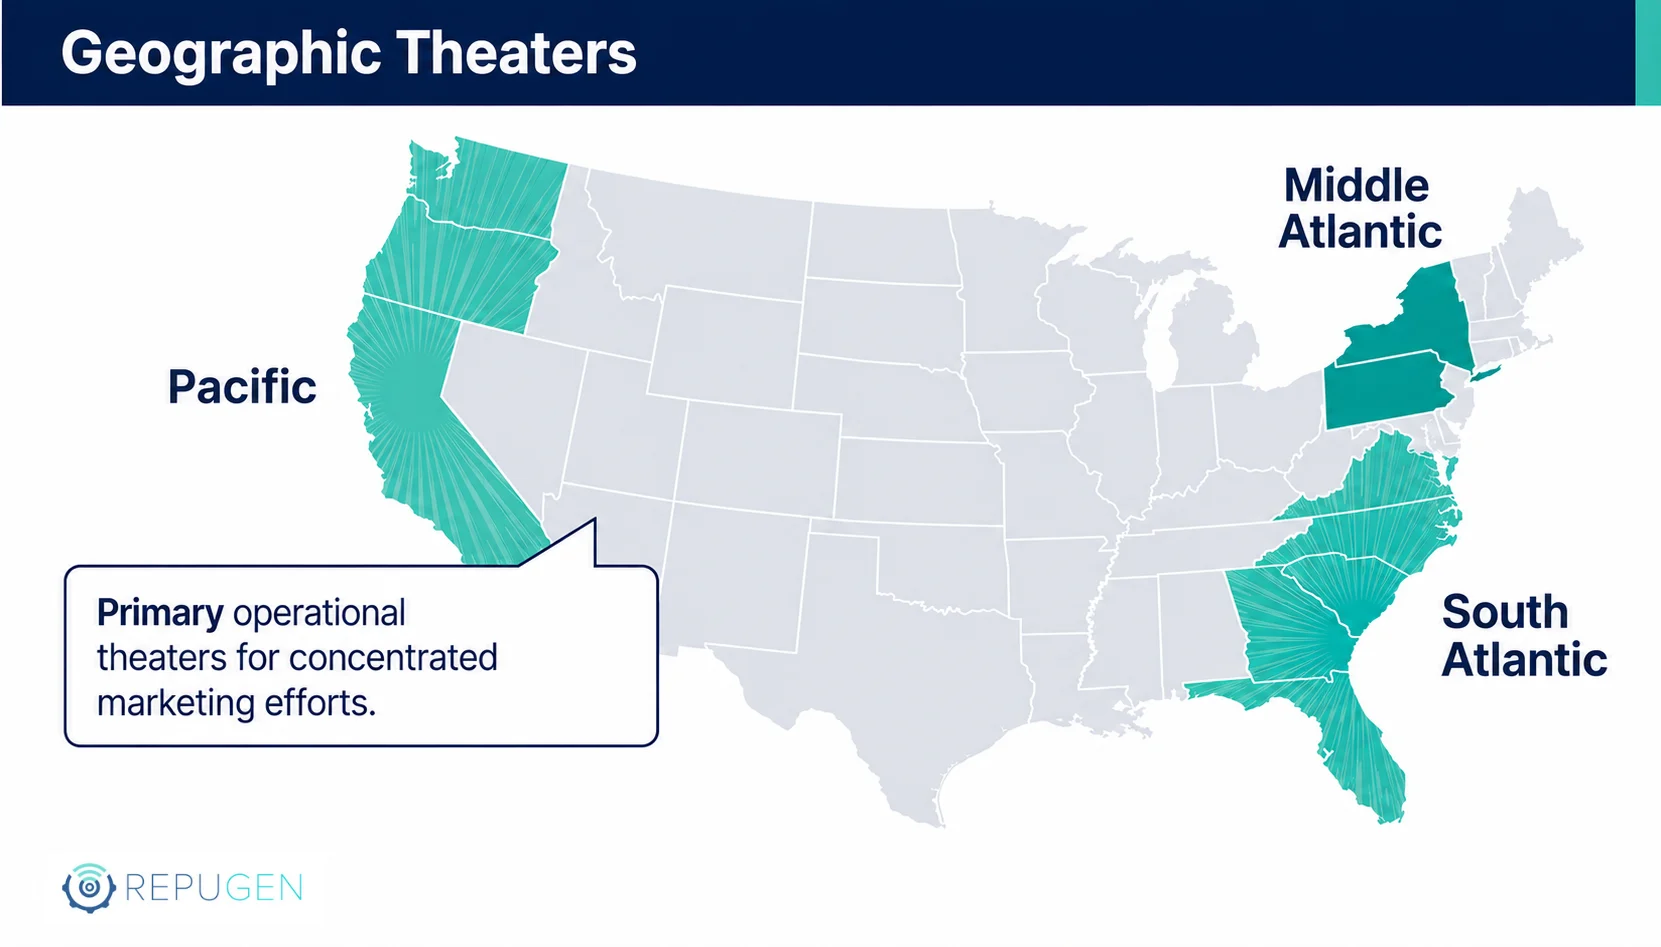
7. The top three US Regions where online reviews influence provider selection are Pacific, South Atlantic followed by Middle Atlantic regions hence it indicates an opportunity to focus marketing efforts heavily in these areas.
8. Income based differences in Recency and Engagement with Online Reviews
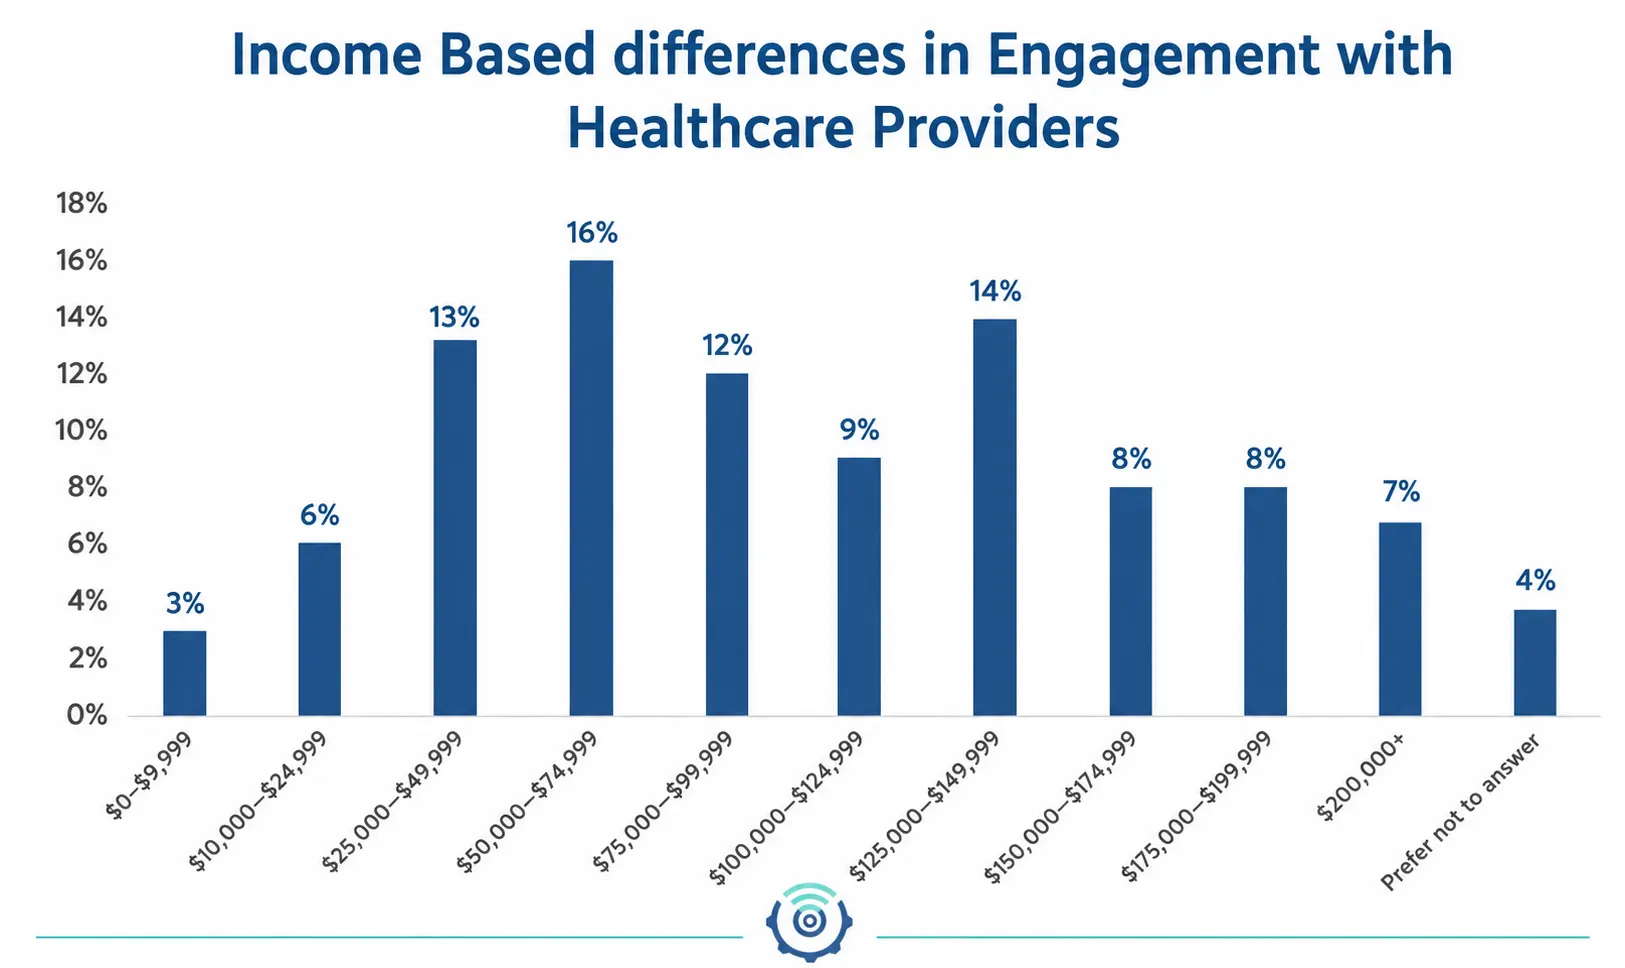
Observation:
Engagement with healthcare providers varies across the income groups, with higher participation observed in the $50K–$74K (~16%), $125K–$149K (~14%), and $25K–$49K (~13%) segments. In contrast, lower participation is seen at the extreme ends of the income spectrum, including <$10K (~3%) and $200K+ (~7%).
Why it happens:
- The variation in engagement across different income groups is driven by differences in healthcare interaction frequency, with mid-income segments representing a more active and accessible population base.
- Extremely low and high-income groups show lower representation and act as outliers with narrower interaction windows, which should be interpreted with directional context.
RepuGen Implication:
A segmented reputation strategy should be followed where no one size fits all. Focus reputation building efforts on mid-income segments, where engagement is highest and impact potential is greater.
9. The Quantity of reviews act as a Trust Multiplier
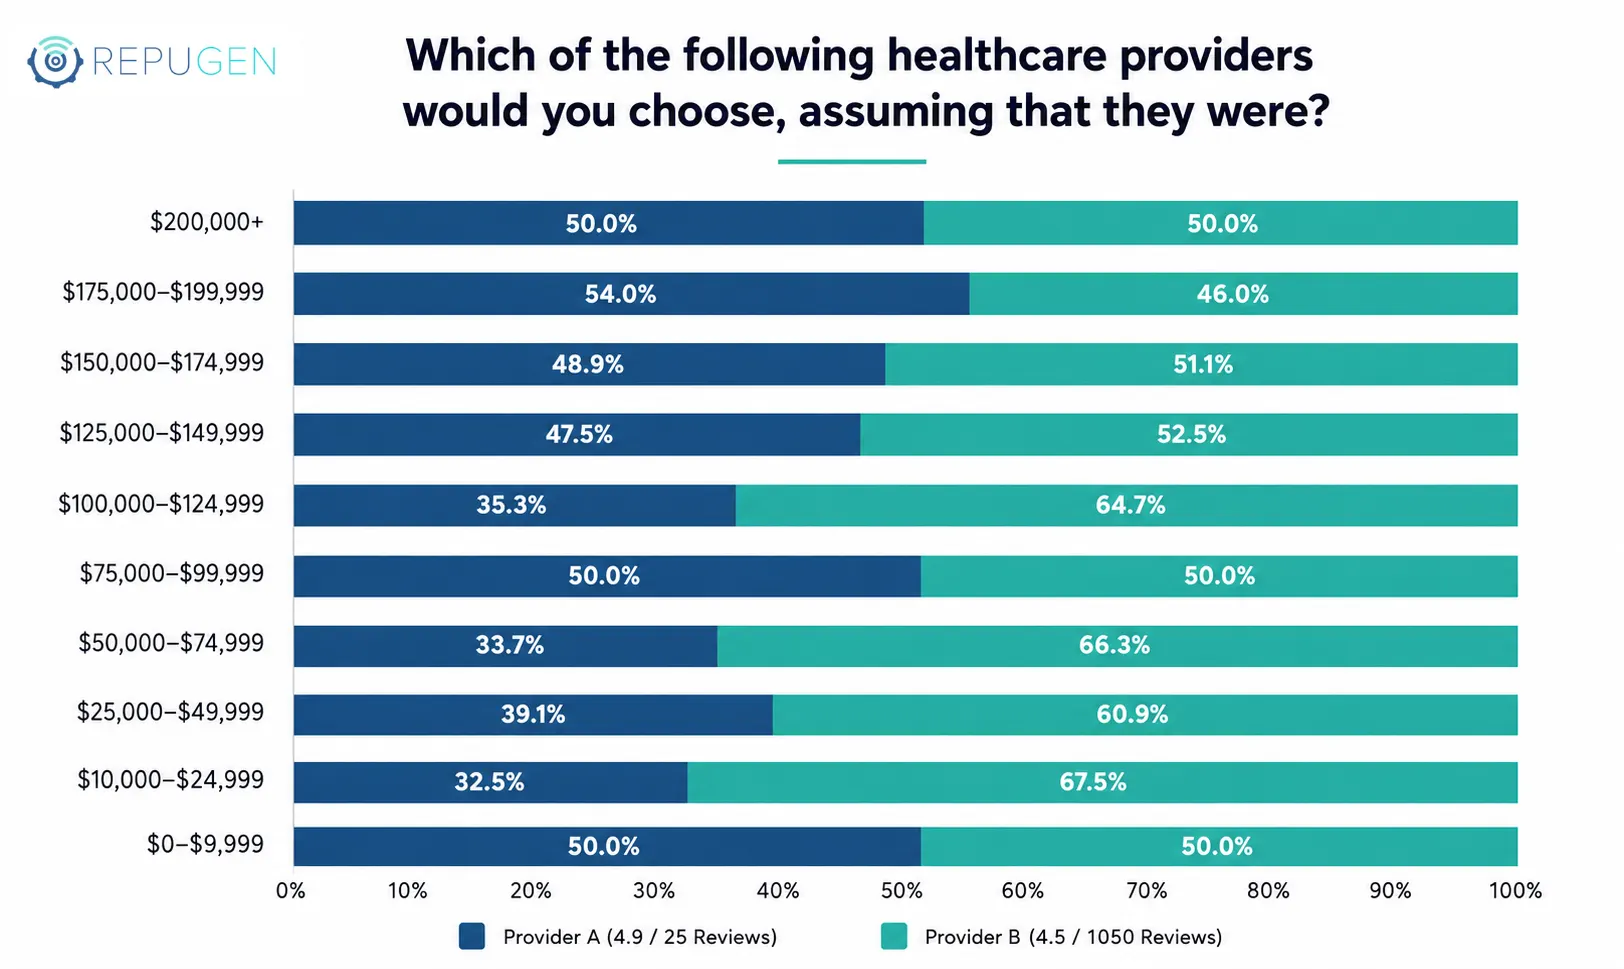
Observation:
Preference for high review volume peaks in the $10K-$124K income brackets, where up to 67.5% of patients favored Provider B (4.5/ 1050 Reviews), showing that the core market demographic values social proof over perfection.
Why it happens:
Bayesian Trust: Consumers intuitively understand that as the number of reviews increases, the average becomes a more accurate representation of truth. A 4.9 rating with only 25 reviews is viewed as statistically unstable.
RepuGen Implication:
Marketing efforts should shift from highlighting ‘the best doctor’ with high rating to ‘the most trusted doctor’ with high review volumes as it is the primary driver for booking intent in the higher review range.
Conclusion
- The critical window for feedback capture: With 80% of patients visiting a provider within the last quarter, there is a consistent but perishable flow of recent experiences. Therefore, the providers must implement automated triggers to capture feedback within 24 to 72 hours post visit, while the experience is still top-of-mind.
- Demographic sensitivity in reputation management: Reliance on online reviews is a near universal behavior, but it peaks significantly among mature adults aged 45-60 (~86.1%). Conversely, gender-based analysis revealed that while men focus on quantitative star ratings, women lean into narratives, necessitating a multi-faceted presentation of provider data.
- Targeting the ‘economic core’ for engagement: The study identifies mid-income cohorts (specifically the $50K–$74K and $125K–$149K segments) as the most active participants in healthcare reviews, hence there is a need to focus reputation-building efforts on these high-engagement demographics which maximizes the marketing ROI.
- Volume over perfection as a trust catalyst: The data suggests that a high volume of reviews is more influential than a perfect rating, with 56.8% of patients choosing a 4.5 star provider with 1,050 reviews over a 4.9 star provider with only 25. Large review datasets provide Bayesian trust, where patients view a high volume of feedback as a more authentic and statistically stable representation of the actual care experience.